
CoreWeave rents out computing power to the companies building artificial intelligence. To do that it borrowed around $50 billion and bought a great many chips. On Wednesday its stock fell 15.5%. By Thursday its bonds due in 2031 yielded more than 16%, a level lenders usually reserve for companies they expect to struggle.
The trigger was an American inflation report. Consumer prices rose 3.7% over the year to September against 3.6% expected, and a day later producer prices jumped 1.3% in a single month, the biggest rise since March 2022. Both made another rate rise from the Federal Reserve more likely, and higher rates raise the interest bill of every company that lives on borrowed money.
The selling spread fast. The Nasdaq Composite lost 4.5% on the week, and Korea’s main index, which is mostly two memory-chip makers, lost 14.5%.
America’s government borrowing costs fell anyway. Investors frightened by falling stocks bought Treasuries, and the ten-year rate dropped 15 basis points to 5.09%. Oil went the other way and closed Friday at $109.86, its highest since May.
But now let’s grab a coffee and go through it properly.
The Scoreboard
Nineteen numbers, and the bottom half of the Asia block is the place to look first.
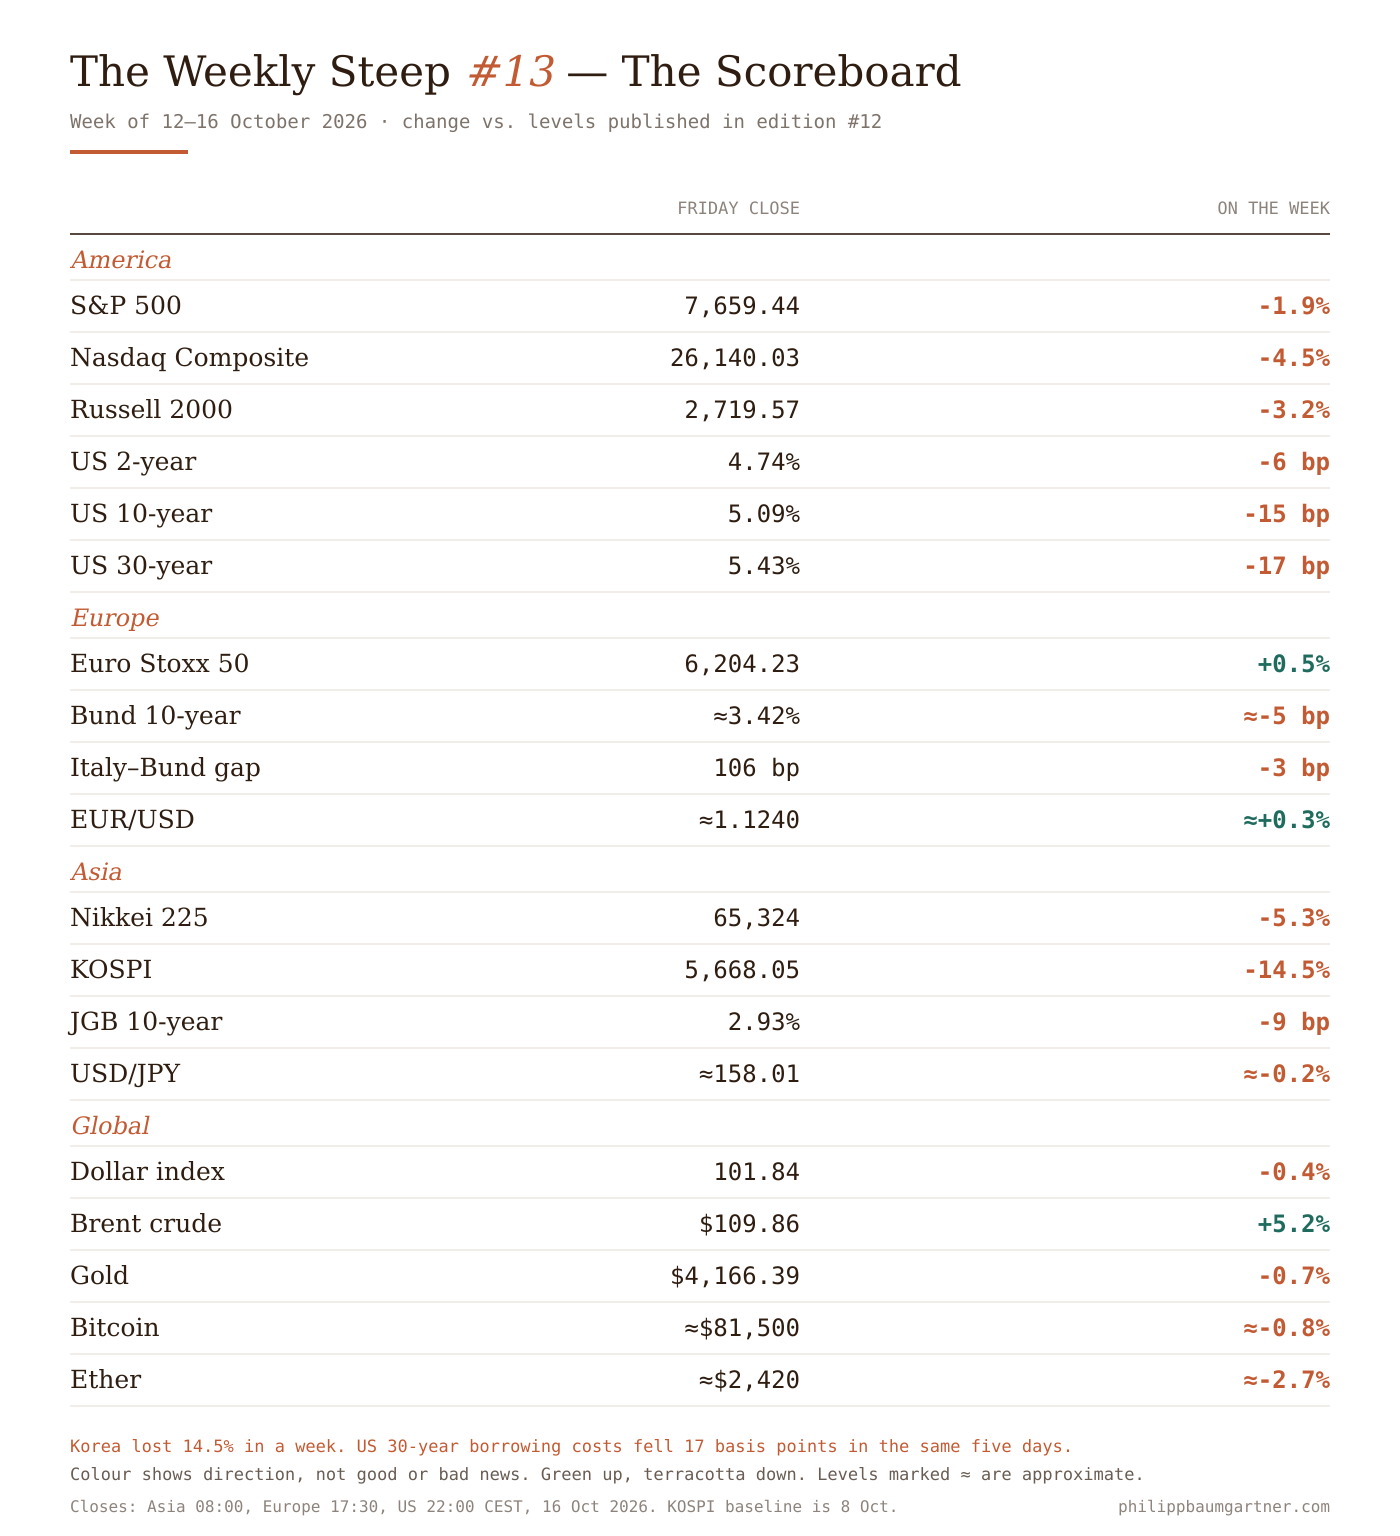
America had a bad week for stocks and a good one for bonds. The S&P 500 fell 1.9% to 7,659.44 and closed Friday at its low for the week. The Nasdaq Composite lost 4.5% to 26,140.03, its worst week since June, and smaller companies in the Russell 2000 dropped 3.2%.
Government borrowing went the opposite way. A basis point is one hundredth of a percentage point, and the thirty-year rate fell 17 of them to 5.43%, the ten-year 15 to 5.09%. The two-year, which mostly tracks what traders expect the Fed to do next, fell only 6 to 4.74%. Chapter two is about why those two numbers moved so differently.
Europe was the calm corner of the world. The Euro Stoxx 50 even rose 0.5% to 6,204.23. German ten-year borrowing slipped about 5 basis points to around 3.42%, and Italy’s extra cost over Germany narrowed 3 to 106.
Asia took the damage. The Nikkei 225 lost 5.3% to 65,324, and the KOSPI 14.5% to 5,668.05. The yen barely moved, still near 158 per dollar.
Brent crude rose 5.2% to $109.86 as attacks on shipping near the Strait of Hormuz continued. Gold slipped 0.7% to $4,166.39, and bitcoin 0.8% to about $81,500.
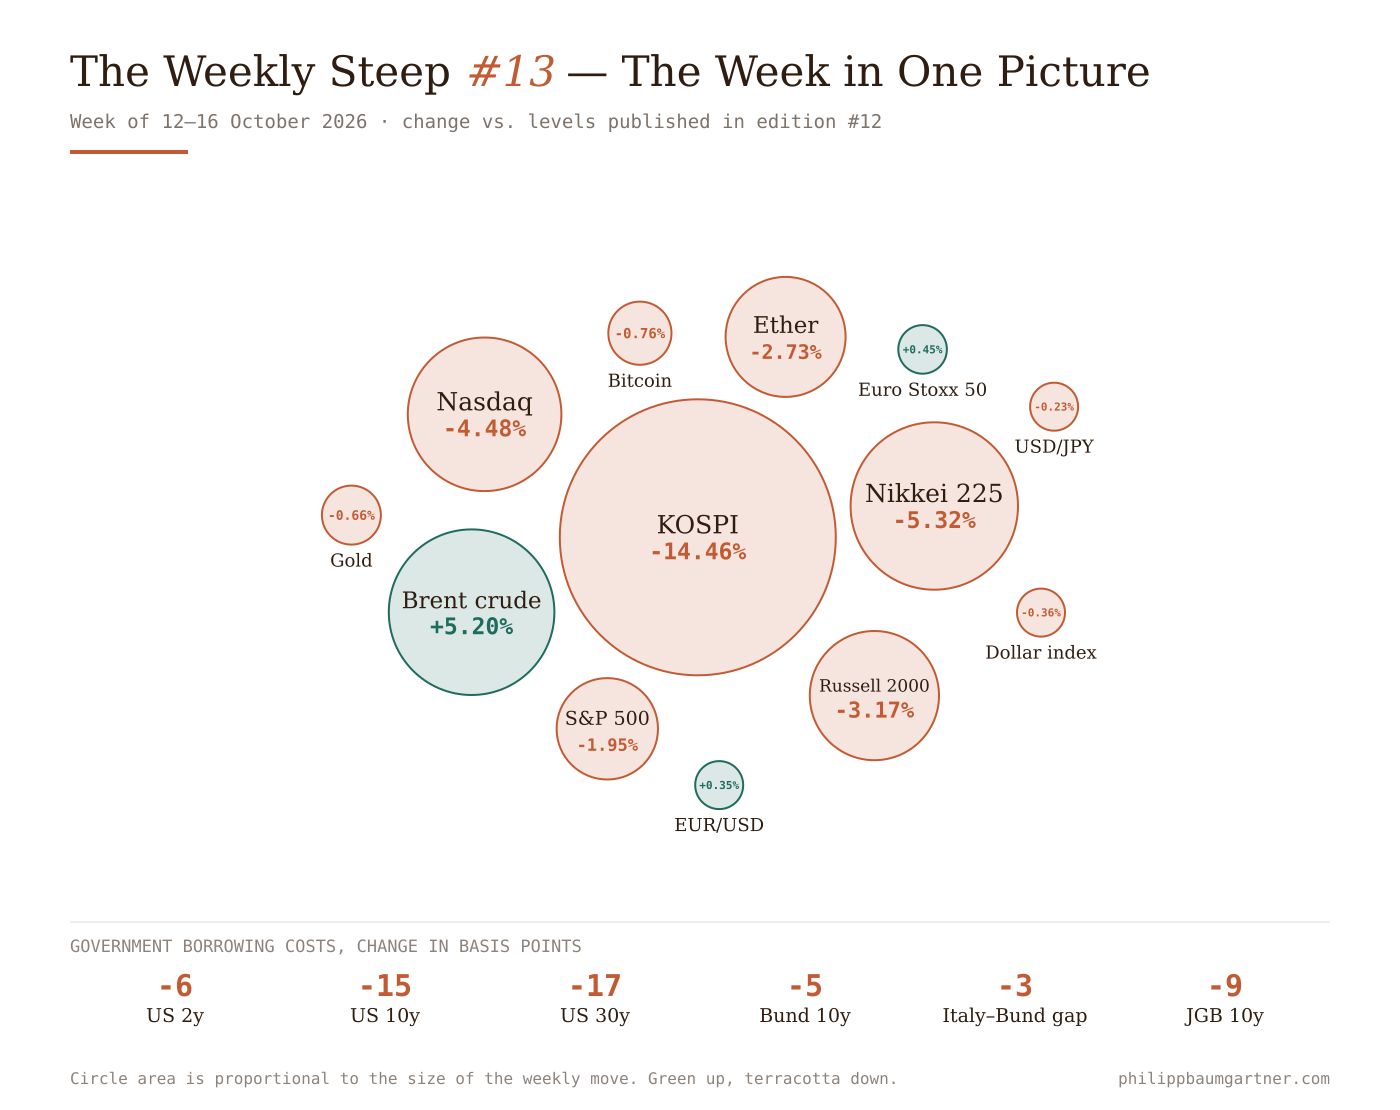
The largest circle belongs to Korea, almost three times the size of the next one. The only big green circle is oil. Nearly everything else that fell was a stock tied in some way to the AI build-out, and every number in the bond strip is red, which for bonds means borrowing got cheaper.
1. CoreWeave’s lenders asked for 16%
A company that wants to grow fast with little cash of its own borrows. CoreWeave did that on a large scale. It buys Nvidia chips, puts them in data centres and rents the computing power to AI labs and big tech firms. Its debt and similar obligations come to more than $51 billion.
For a borrower like that, two numbers decide almost everything: what customers pay, and what lenders charge. This week the second one moved. Wednesday’s inflation report raised the odds of another Fed rate rise, and every rise makes refinancing dearer. Lenders began asking whether CoreWeave can carry its interest bill out of the cash it actually earns.
Their answer showed up in prices. The yield on CoreWeave’s 2031 bonds, meaning the yearly return a buyer locks in at today’s price, passed 16% on Thursday. Insurance against the company defaulting, which trades as a credit default swap, rose to a record of more than 1,000 basis points. Put simply, protecting $1 million of its debt now costs over $100,000 a year.
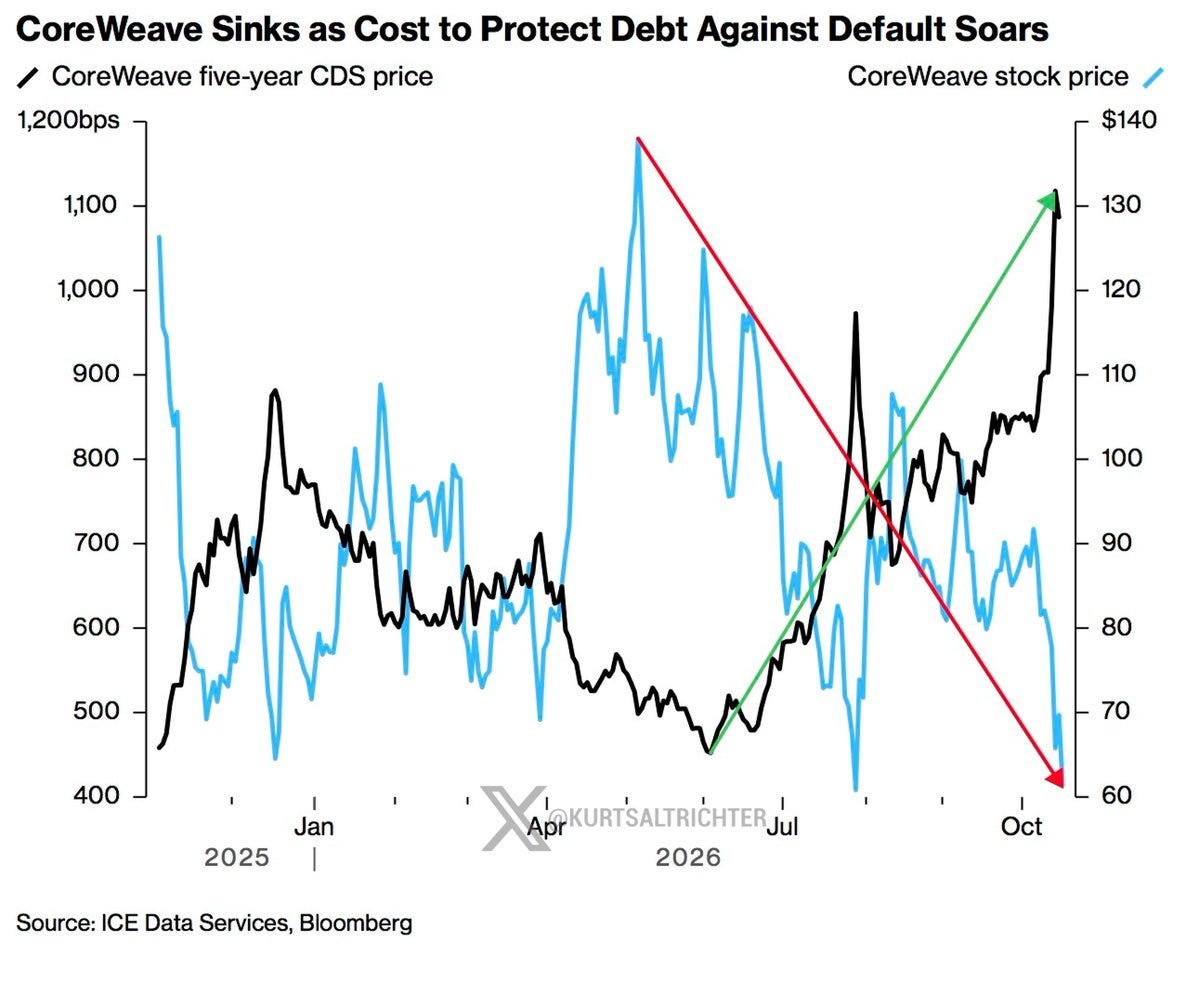
The worry travelled. Oracle, also borrowing heavily to build data centres, fell 8.8% on Wednesday, and the yield on its 2032 bonds rose to 7.24%. People who own the stock stand behind lenders in the queue and only get paid once bondholders have been, so the stock tends to move first and furthest when lenders grow nervous.
The other side deserves a fair hearing. CoreWeave’s chief executive told staff that signed customer contracts more than cover the company’s debt. Jensen Huang, who runs Nvidia, said the turmoil will pass. And most of the build-out is paid for by companies with enormous earnings of their own, even if they too have sold well over $200 billion of bonds this year.
My read: lenders now price AI borrowers one at a time, and those without steady cash coming in pay the most. The sign of real spreading would be the bond yields of the biggest technology companies climbing alongside CoreWeave’s. That has not happened yet.
2. Hot inflation, cheaper borrowing
Inflation reports usually push government borrowing costs up. This week both arrived in the same 48 hours, and borrowing costs came down.
September’s consumer prices rose 0.6% in the month. The core measure, which leaves out food and energy, rose 0.3% against 0.2% expected. On Thursday came producer prices, which track what businesses get paid for their goods before those goods reach a shop. They jumped 1.3%. Goods alone rose 2.6%, the largest monthly increase since the series began in 2009, with petrol up 20.3%.
Two forces pulled on bond prices at once. Higher inflation makes a Fed rate rise more likely, and that pushes yields up. Falling stock prices send frightened money into government bonds, and that pushes yields down. On Thursday the second force won clearly: the ten-year yield fell more than 10 basis points to 5.09% while traders were still reading the producer price report.
The two-year shows the first force never left. It fell only 6 basis points all week. Futures traders briefly lifted the chance of a rate rise at the 27–28 October meeting from about 22% to 47% after the CPI, then let it drift back to roughly a third. A rise by December is priced at more than 90%.
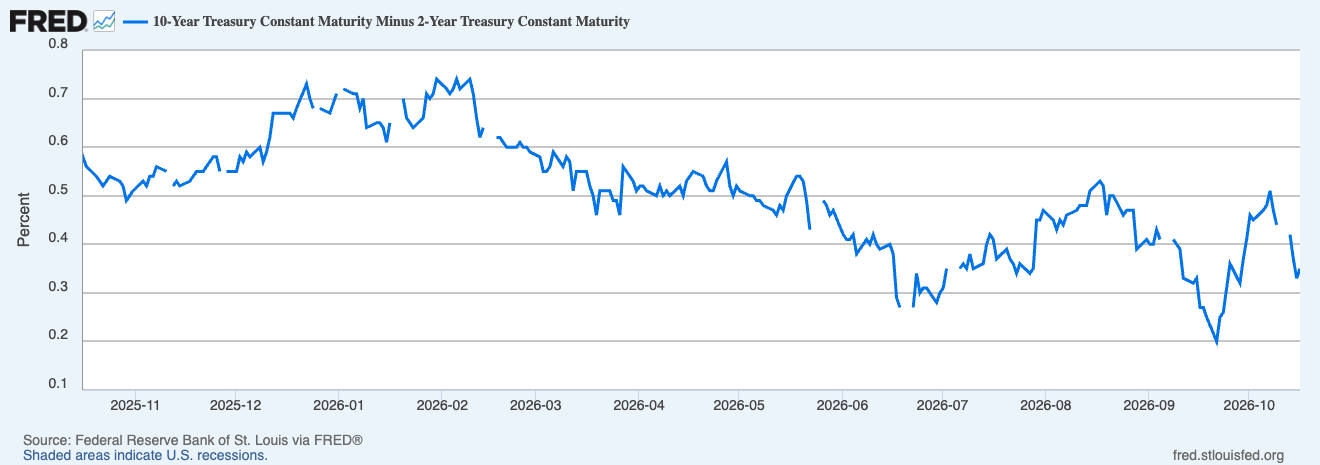
So the gap between two-year and ten-year borrowing narrowed from 44 basis points to 35. That shape says investors expect the Fed to keep money tight now and growth to soften later. Last week the bond market was worried about government debt. This week it was worried about growth.
Hold that loosely, though. Most of the move came on a single day of fear, and by Friday the ten-year was already creeping back up.
3. Korea lost a seventh of its stock market in a week
The KOSPI closed at 6,625.93 on 8 October, before Seoul shut for a holiday. Five sessions later it stood at 5,668.05. Four of those five days were losses.
Thursday was the worst. The index fell 7.57% to 5,554.22, and trading was paused twice by automatic brakes that kick in when prices fall too fast. Foreign investors sold 3.6 trillion won of Korean stocks that day. Samsung Electronics lost 9.5% and SK hynix 11.1%.
The reason is concentration. Samsung and SK hynix make the memory chips that AI data centres buy, and together they carry roughly half of the index. Once lenders started questioning the companies buying those chips, investors started questioning how long the orders keep coming. Foreign funds own a big slice of both firms and can leave quickly, and they had been net sellers for thirteen sessions in a row before Friday.
Tokyo felt it too. The Nikkei fell 3,318 yen on Thursday, the third-largest point drop in its history, and the Japanese press called it the CoreWeave shock.
The best argument against panic is that nothing inside these companies changed. Samsung reported record results the week before, and on Friday the KOSPI rose 2.05% as foreign investors turned buyers again.
Two things went genuinely well. Europe’s main index rose 0.5% while the rest of the world sold. And Britain’s economy grew 0.1% in August, when economists had expected it to shrink.
Data Check
Six releases mattered, and all six came in above forecast.
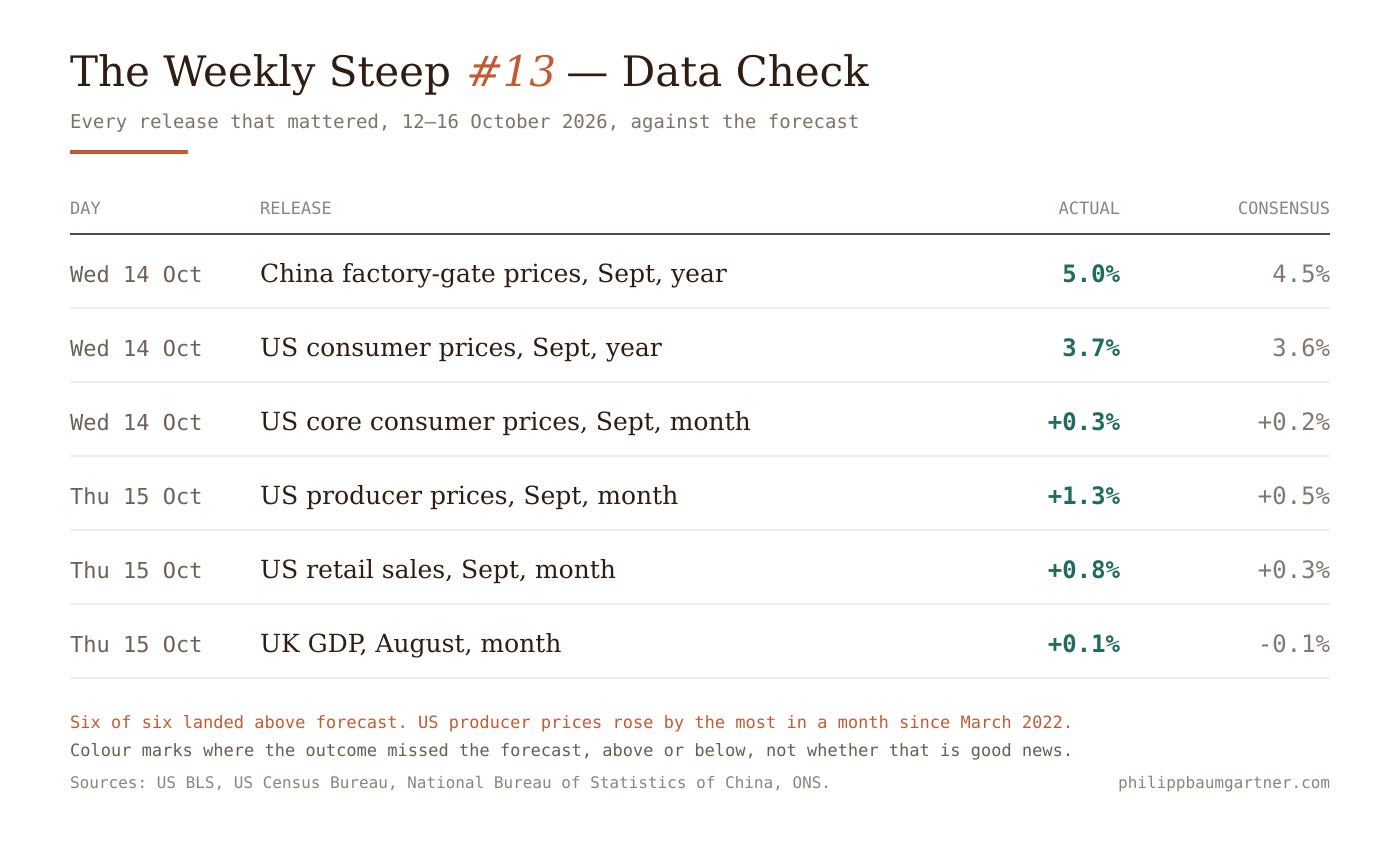
The producer price row is the one to read twice. Prices that businesses charge each other usually reach shoppers a few months later, so a 1.3% jump in September points to more inflation in October and November consumer prices. Petrol explains much of it. Even with food and energy left out, though, producer prices still rose 0.7%.
The retail sales row is weaker than it looks. Total sales rose 0.8%. The narrower measure that leaves out cars, petrol, building materials and restaurants is the part closest to what households choose to spend, and it rose only 0.1% against 0.3% expected. Americans spent more mainly because petrol cost more.
China’s factory-gate prices rose 5.0% over the year, the most since mid-2022. For years China sold the world falling prices. It is now selling it rising ones.
The Credit Grind
Chapter one was about one borrower. This section checks whether the rest of the corporate bond market caught the same cold.
Anyone lending to a company is paid for two things. One is the price of money itself, which governments set. The other is compensation for the chance this particular borrower stops paying. The company rows measure that second part, in basis points on top of the government rate.
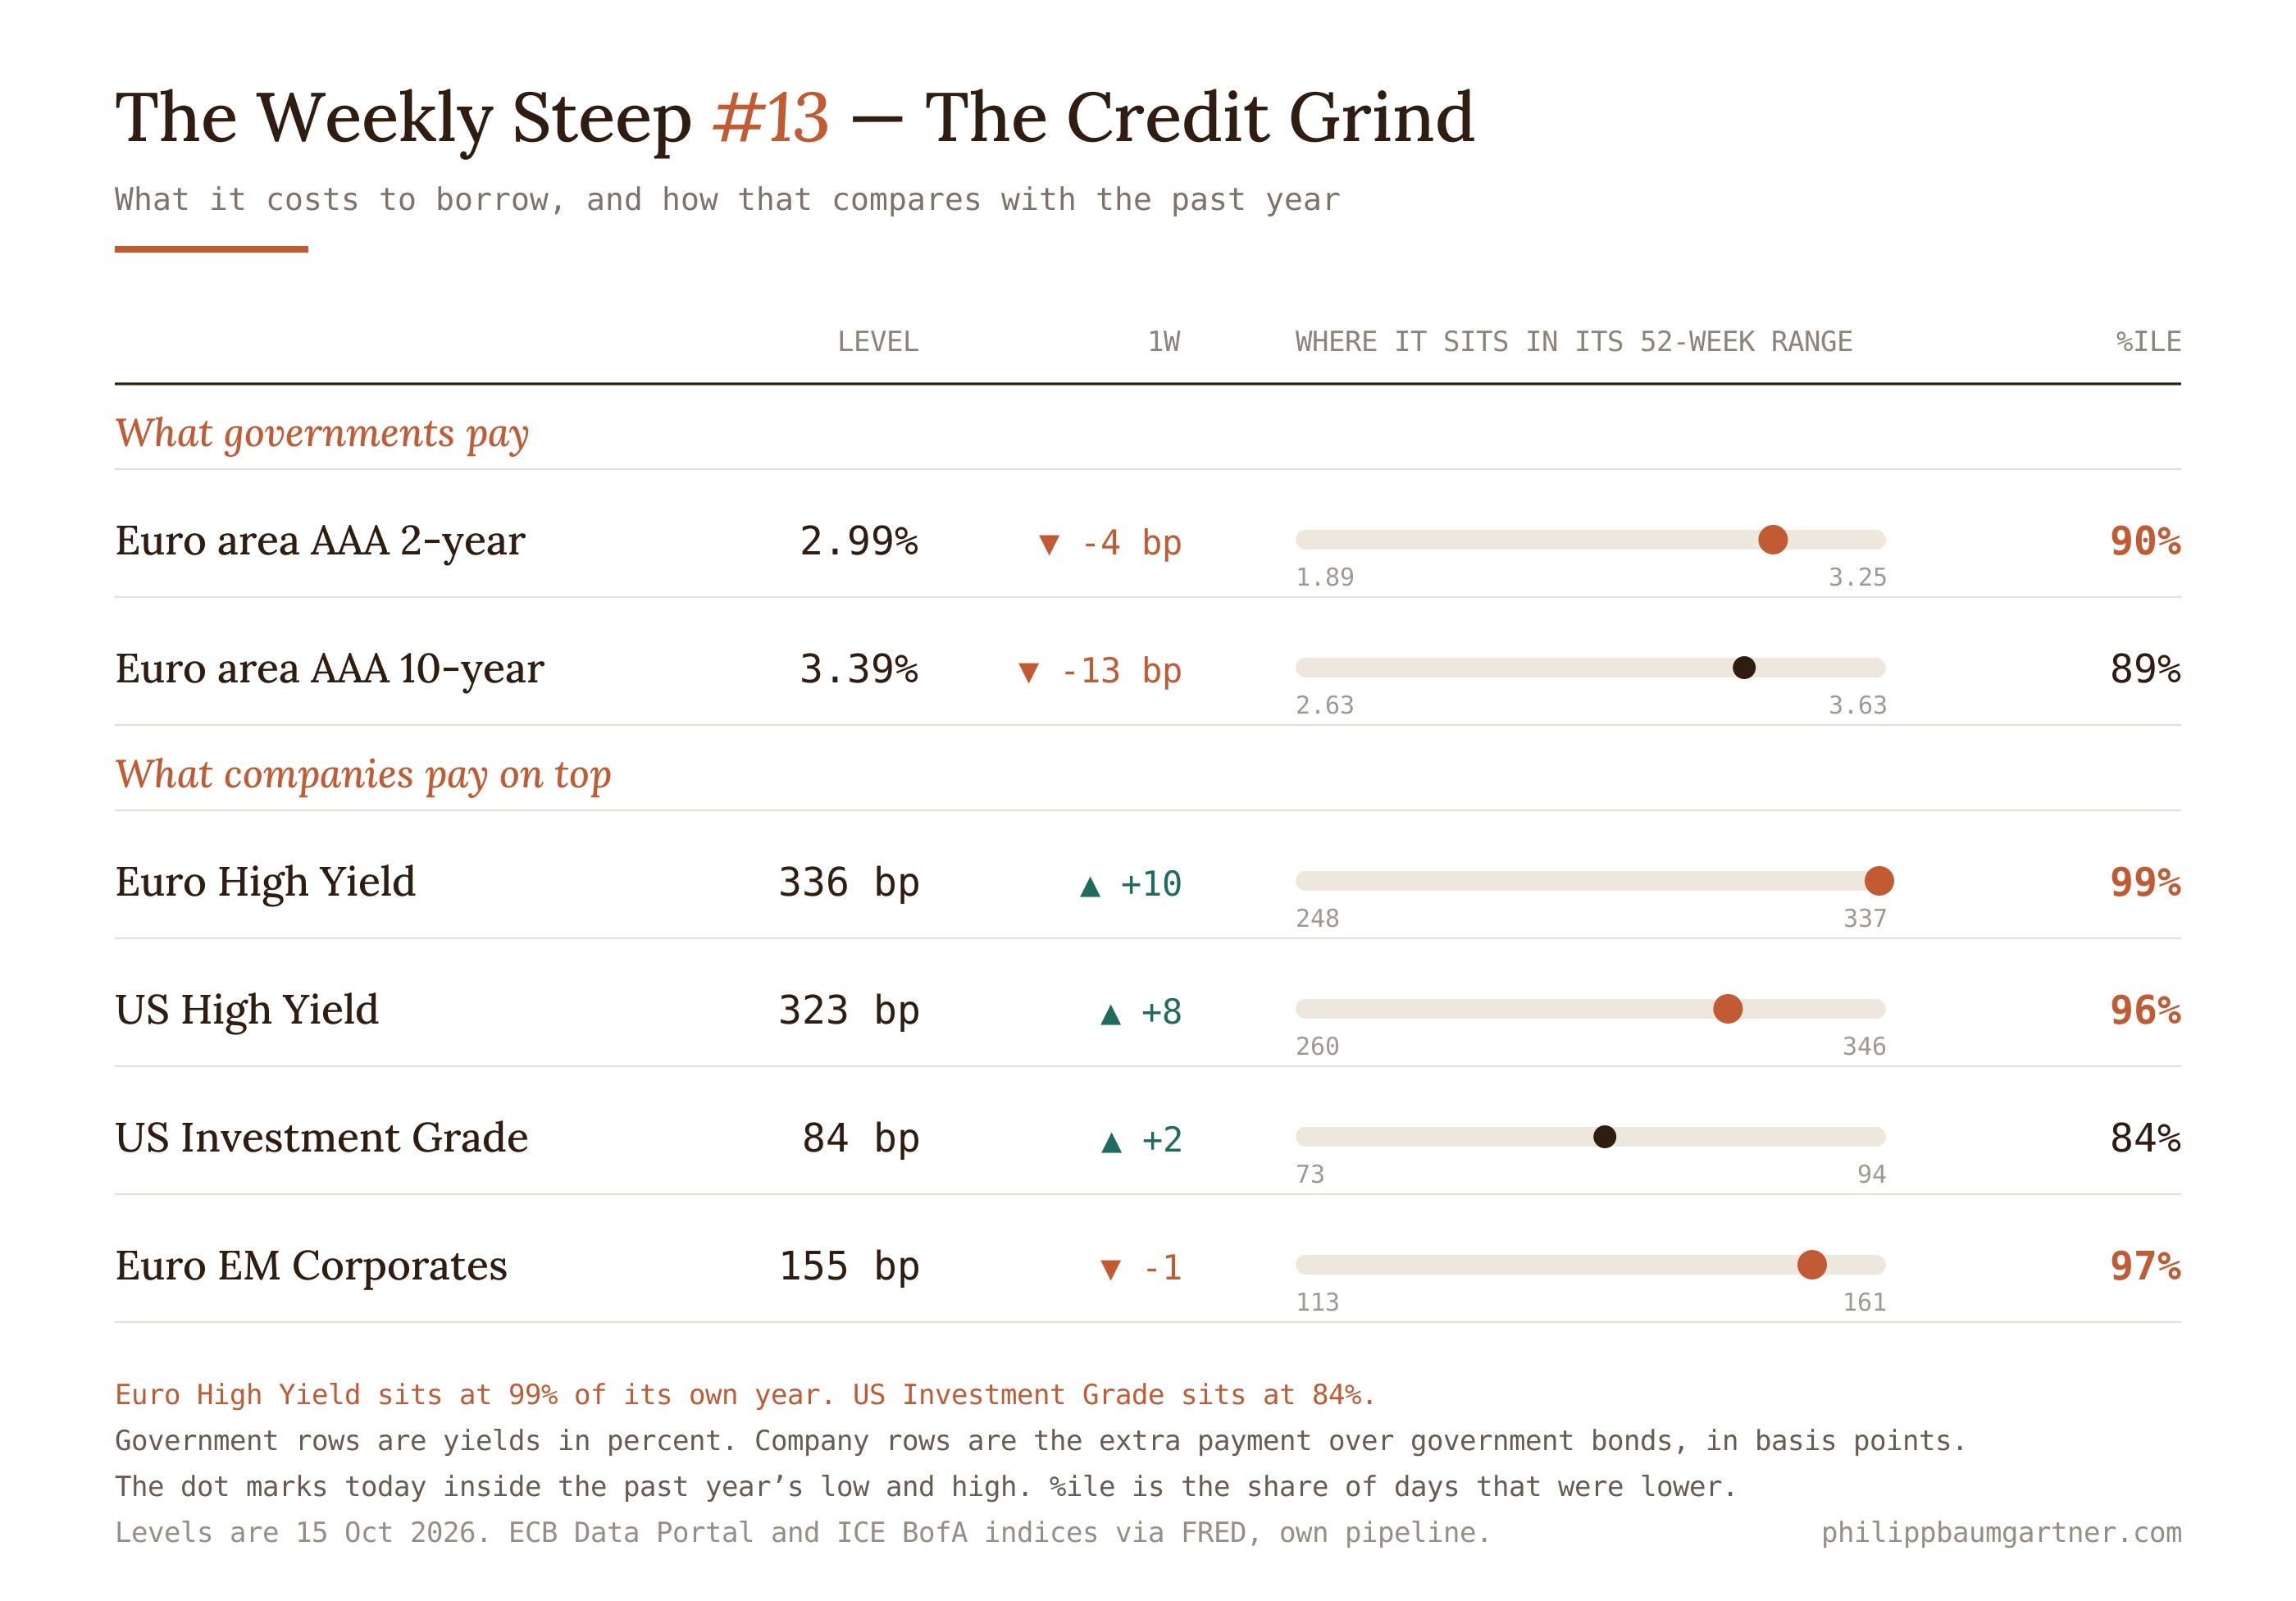
The riskiest European companies now pay 336 basis points on top, 10 more than a week ago. The last column reads 99%, which means hardly a day in the past twelve months was dearer. The year’s high is 337, a single basis point away. America’s junk-rated companies, those rated least likely to repay, rose 8 to 323. Large, solid American companies barely moved, up 2 to 84.
So the scare spread, but only to the bottom of the ladder. The weakest borrowers got dearer on both continents, and the strong ones were left almost alone. That fits chapter one: lenders sorting borrowers by how much cash they actually bring in.
The government rows explain why it hurt less than it sounds. Euro-area ten-year borrowing fell 13 basis points to 3.39%, the two-year 4. For a European junk borrower, the falling base rate and the rising premium nearly cancelled each other out. The total bill stayed roughly where it was, and the relief from cheaper government money went to the lender as extra compensation.
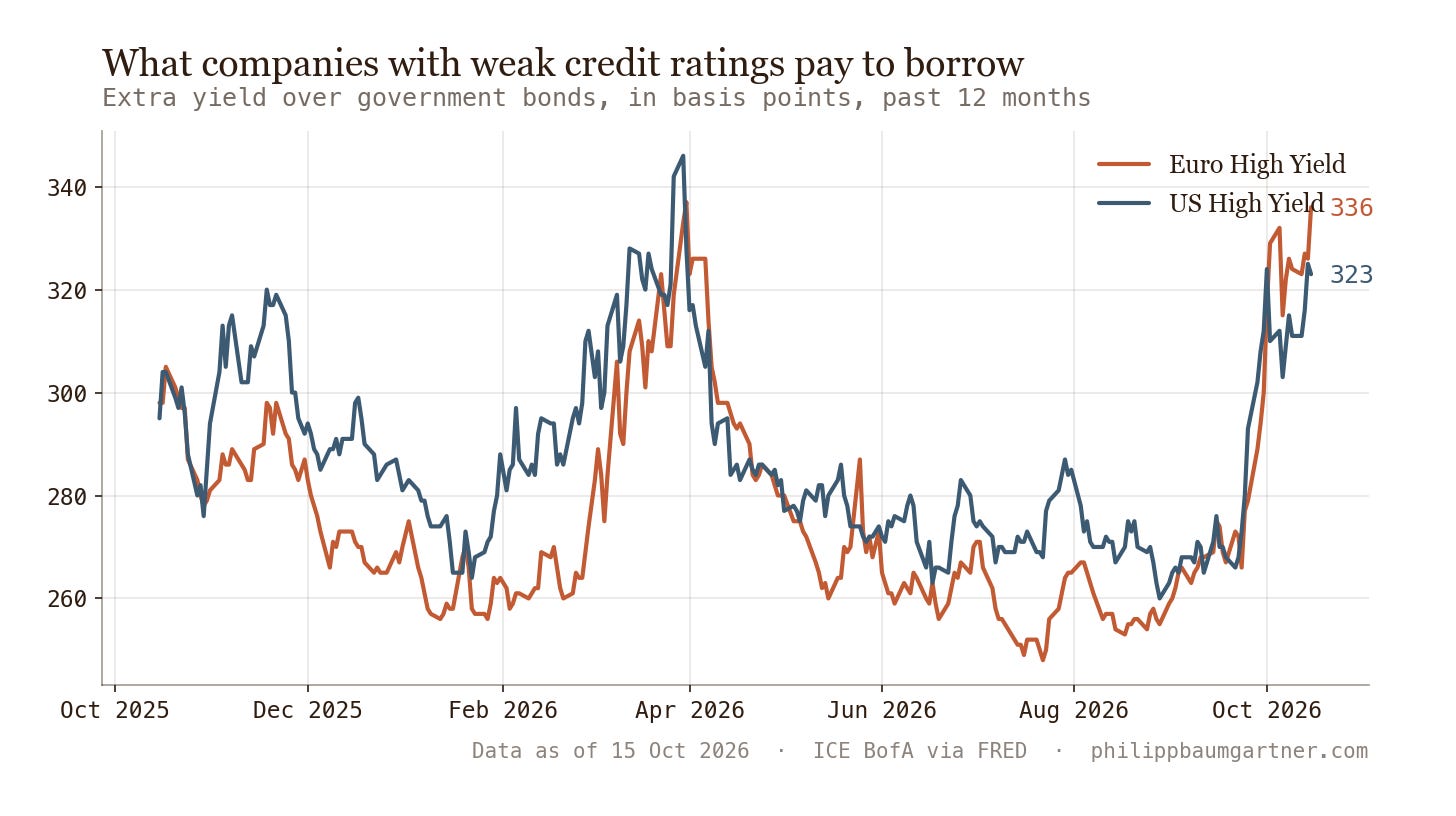
The gap between the two junk markets widened to 13 basis points, with Europe the dearer one for a second week. France’s budget trouble sits behind much of that, as it did last week.
So what does this mean for anyone holding a corporate bond fund? You are now paid close to the most all year for lending to weak companies. That extra pay arrived because lenders grew more worried, and the bonds you already held lost a little value on the way.
The Onchain Pour
Bitcoin held up better than the stocks tied to it. It finished near $81,500, down 0.8% on the week. On Thursday morning, right after the producer price report and Korea’s worst day, it fell below $80,000 for about two hours before buyers stepped in near $79,800 for the third time in a week.
The companies built around bitcoin had a far rougher Friday. Coinbase fell 5.8% and Strategy 9.6% as the Nasdaq slid. Ether lost 2.7% to about $2,420.
The funds stayed cautious. US spot bitcoin funds, which hold actual coins and trade like stocks on an exchange, saw roughly $229 million leave over the week. Ether funds lost about $320 million.
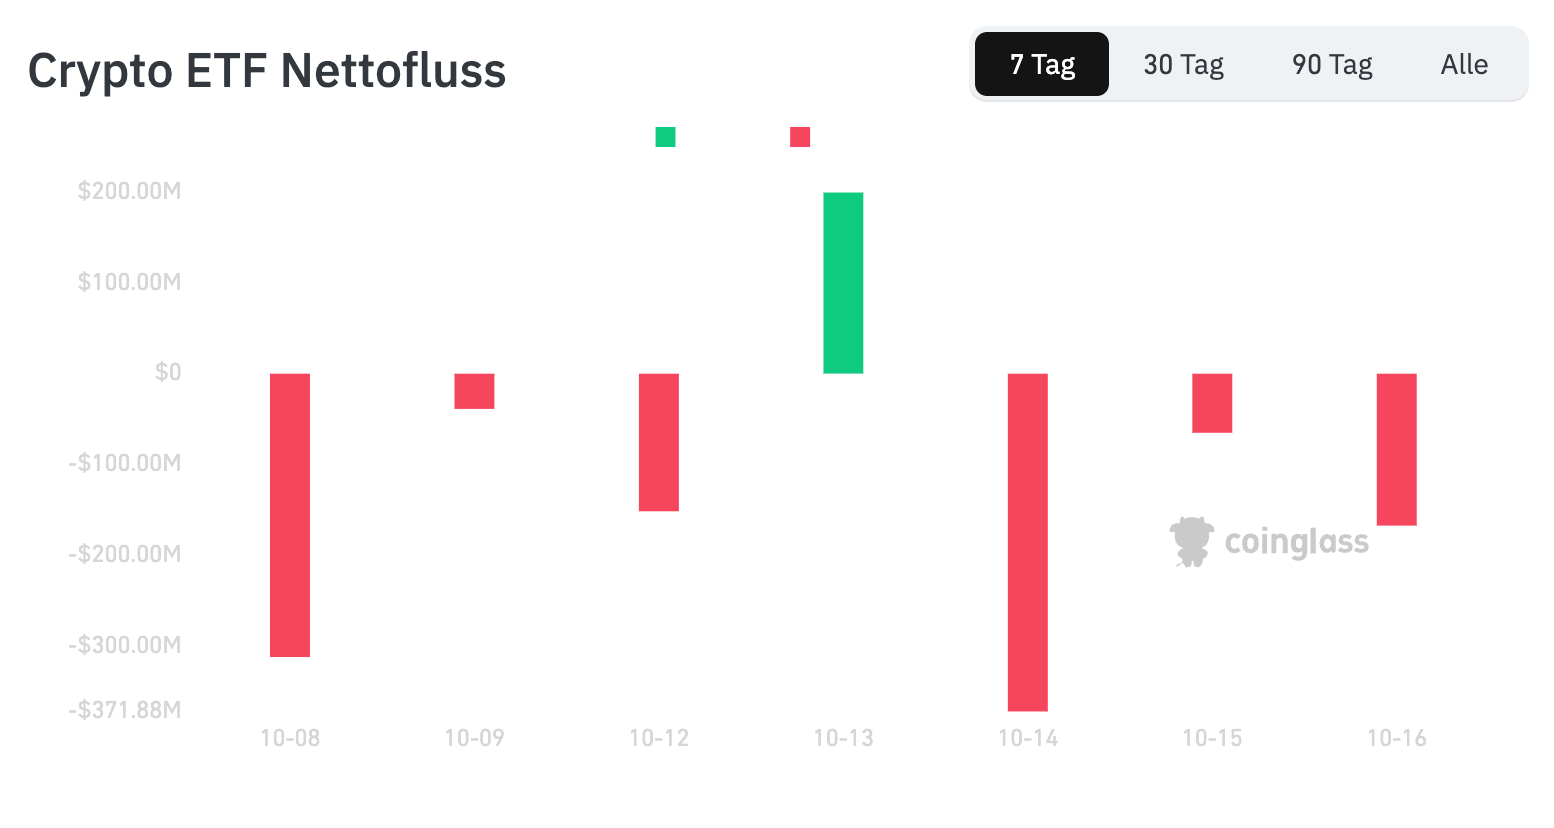
October has been unusually poor. Bitcoin opened the month at $83,576 and sits a couple of per cent below it. It has not finished two Octobers in a row lower since at least 2013, and last October was one of the red ones, so a weak finish this month would break that pattern.
The Week Ahead
The Fed meets on 27 and 28 October, and from this weekend its officials stop speaking in public about policy. That leaves the data to speak for them, and there is no American inflation report this week. The question running through the week is whether this one’s two shocks keep going: lenders backing away from AI borrowers, and oil above $100 feeding prices everywhere.
Britain and Japan publish inflation figures, and both central banks are under pressure to raise rates into an oil shock. The flash business surveys on Friday carry a measure of what companies pay for their inputs, which is the earliest place an oil price shows up.
Korea’s central bank meets on Thursday, a week after the KOSPI’s worst day in months. Raising rates into a falling market is unusual, and some forecasts expect exactly that.
China GDP, third quarter — Monday, 04:00.
Consensus 4.4% after 4.3%. Factory output and retail sales land at the same time, the latter barely growing at 0.4%.
Canadian inflation — Monday, 14:30.
Previous 3.0%. A first read on how quickly North American fuel costs reach the shops.
German ZEW survey — Tuesday, 11:00.
Consensus 31.6 after 34.7. It asks financial analysts how they expect the German economy to do over the next six months.
UK inflation — Wednesday, 08:00.
Consensus 3.4% after 3.1%. A jump of that size would put a Bank of England rate rise firmly back in play. Christine Lagarde speaks at 18:00.
Bank of Korea decision — Thursday, 03:00.
The rate sits at 3.00%. Trading Economics expects a rise to 3.25%.
US jobless claims — Thursday, 14:30.
Consensus 200,000. New claims for unemployment support have stayed near their lows all autumn.
Japanese inflation — Friday, 01:30.
Core consensus 2.1% after 1.7%. The Bank of Japan watches this number closely before each rise.
Flash business surveys — Friday, euro area 10:00, US 15:45.
Euro area services consensus 52.8 after 53.0, US services 57.9 after 58.8. Anything above 50 means growth.
University of Michigan sentiment, final — Friday, 16:00.
Consensus 46.3, unchanged from the flash and close to the weakest readings in the survey’s history.
☕ Last Sip
This was the week lenders asked the AI build-out a direct question: can the borrowers pay? For most of the industry the answer is plainly yes. For the companies that borrowed most and earn least, the price of that answer went up sharply, and markets as far away as Seoul paid for the asking.
The bond market’s reaction is the part to keep. Inflation came in hot and borrowing still got cheaper, because fear briefly mattered more than prices did. Fear fades faster than oil at $110 does, and the Fed meets in ten days.
Enjoy the autumn weekend. See you next Sunday.
Sources
Market levels from CNBC, Yahoo Finance, Trading Economics and the US Treasury; ANSA for the Italian–German spread; Chunichi Shimbun and Kyodo for the Nikkei, the yen and Japanese yields; Asia Economy and Money Today for the KOSPI. Economic releases from the US Bureau of Labor Statistics, the Census Bureau, the National Bureau of Statistics of China and the ONS. Credit and euro curve data from ICE BofA indices via FRED and the ECB Data Portal, as of 15 October, own pipeline. CoreWeave and Oracle from CNBC and Reuters. Weekly changes are measured against the levels published in edition #12. Analysis and personal opinion — never investment advice.