
Every government borrows by selling bonds, and the investors who buy them decide what interest they want in return. In Europe that order barely moved for nearly twenty years. Germany paid the lowest rate, because nobody doubts Germany pays its bills. France sat a little above it. Italy sat well above both, charged extra because it owes far more debt than its economy produces in a year.
On Friday, lenders charged France about 4.79% a year to hand over money for ten years. Italy got the same ten years for 4.57%. Lenders now treat France as the riskier bet.
The corporate side is stranger still. About 38% of French investment-grade company bonds, which is roughly €215 billion worth, trade at lower yields than French government debt of the same maturity. In January that figure was €12 billion.
America had a quieter week on the surface. The S&P 500 added 1.1% and set another record on Tuesday. Underneath it, the average company in that index is trading about 16% below its own one-year high, and Goldman’s measure of how many companies are actually taking part is back near where it last sat in 2000.
The Federal Reserve’s September minutes arrived on Wednesday and said most of the committee still expects one more rate rise before the year is out. Korea took that badly and lost 5.4% in four sessions. Crypto took it worse, with about $1.2 billion of positions force-closed on Thursday, nine out of ten of them bets on higher prices.
But now let’s grab yourself a coffee and dive into it properly.
The Scoreboard
Nineteen numbers, and the American rows are the calmest thing on the board. Everything that moved this week moved somewhere else.
Watch the Asia block and the Italy–Bund row. Those two carry the information.
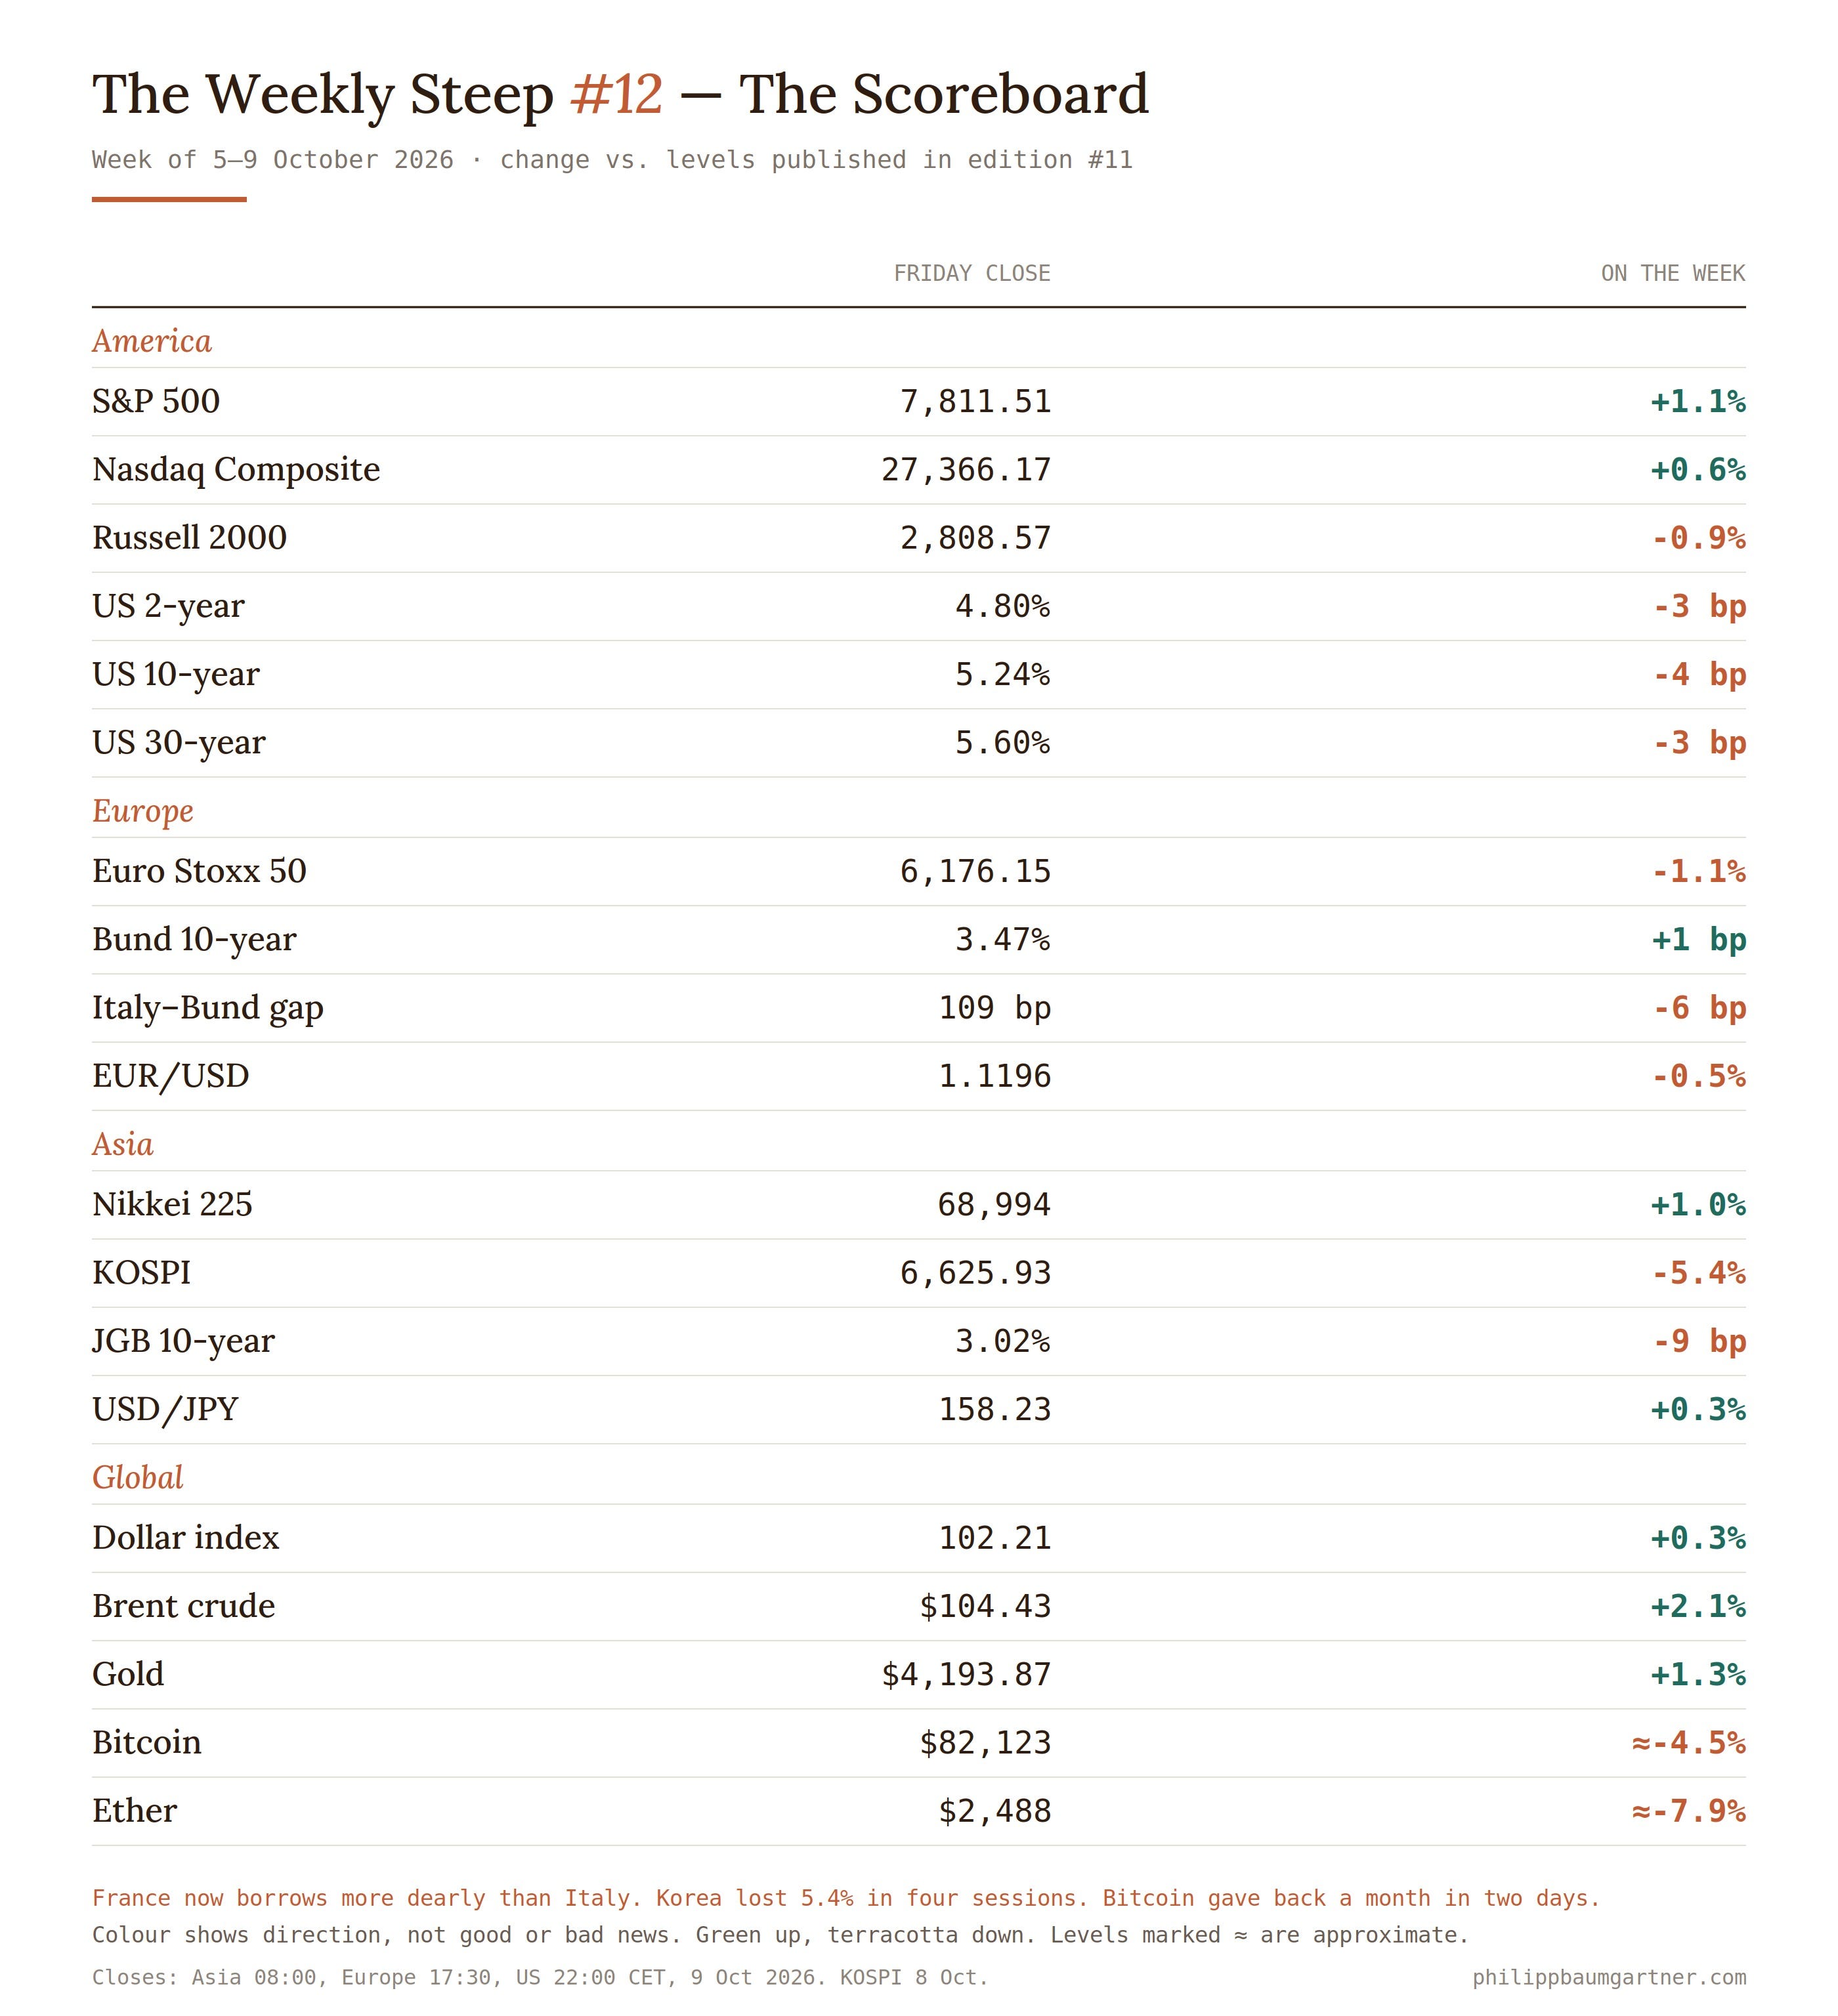
America spent the week doing very little twice over. The S&P 500 closed at 7,811.51, up 1.1%, within a whisker of Tuesday’s record of 7,818.93. The Nasdaq Composite added 0.6% to 27,366.17. Smaller companies in the Russell 2000 went the other way again, down 0.9% to 2,808.57, which is the eighth week out of eleven that they have lagged the big index.
Government borrowing costs came down three or four basis points across the whole American curve — a basis point is one hundredth of a percentage point — leaving the ten-year at 5.24% and the thirty-year at 5.60%. That is the bond market declining to react to minutes that told it another rate rise is coming. Last week’s panic did not continue; it also did not reverse.
Europe is where the week happened, and it happened to France rather than Italy for the first time. German ten-year borrowing barely moved, up a single basis point to 3.47%. Italy’s extra cost over Germany actually fell 6 basis points to 109, the narrowest it has been in a month. France, which does not sit on this board, pays over 130 basis points above Germany and came within five basis points of a round 5% on Thursday. The Euro Stoxx 50 lost 1.1% to 6,176.15, with banks doing most of the damage.
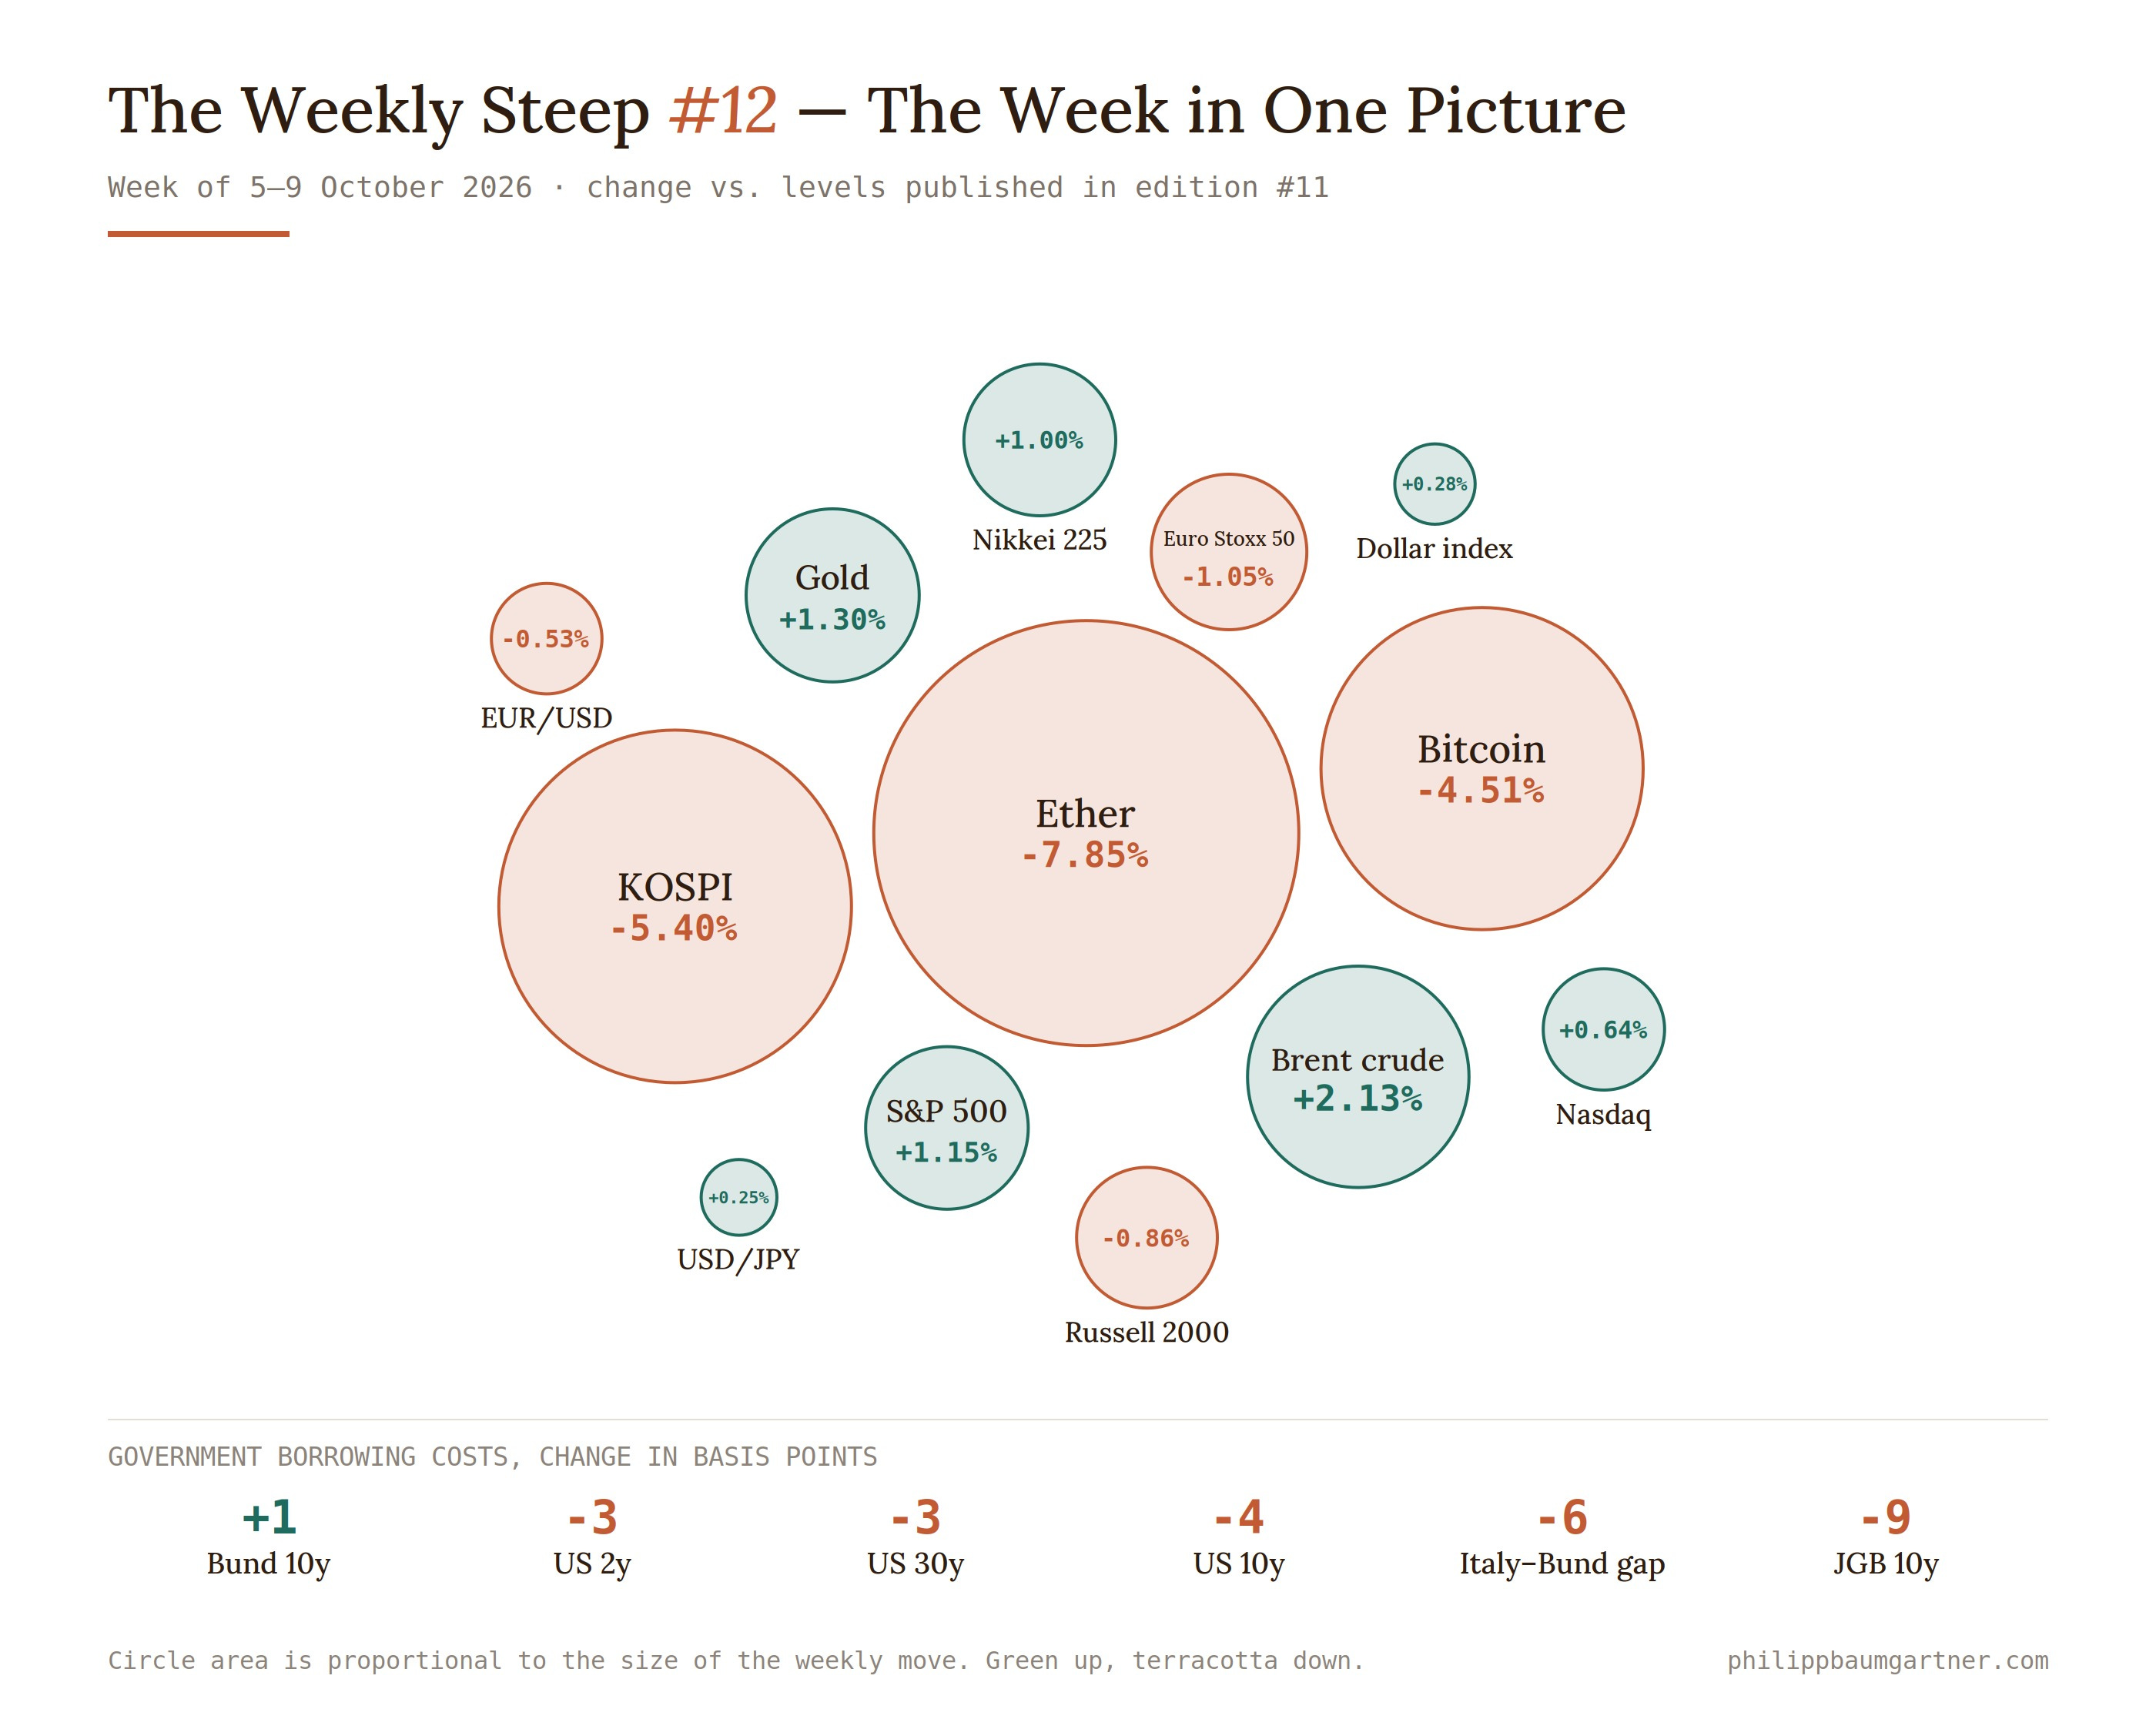
Asia split down the middle. The Nikkei 225 added 1.0% to 68,994, a fourth winning week, while Japanese ten-year borrowing fell 9 basis points to 3.02%. Korea had the worst week of any major market on the board. The KOSPI dropped 5.4% to 6,625.93 in four trading sessions — Seoul was shut on Friday for Hangul Day — with foreign investors selling about 2 trillion won of Korean shares on Thursday alone and domestic institutions another 1.7 trillion. Samsung and SK hynix both fell more than 2% that day. The reason given was oil feeding inflation and American rates staying high, which is a long chain of causation for the best-performing market in Asia this year.
Oil is the number doing the quiet work in this whole letter. Brent closed at $104.43, up 2.1% on the week and up about 66% over twelve months. Gold rose 1.3% to $4,193.87, recovering part of last week’s fall. The dollar index barely moved at 102.21.
The two biggest moves on the board are the two assets people most often buy with borrowed money. Ether fell 7.9% to $2,488 and bitcoin 4.5% to $82,123. That pattern — the leveraged end of the market taking the hit while the index sits at a record — repeats in every chapter below.
1. France is now Europe’s expensive borrower
Size of debt is not what changed. Italy owes about 138.5% of its annual economic output; France owes about 118.1%. What investors are pricing is direction. Italy’s deficit — the gap between what the state spends in a year and what it collects — is 2.9% of output, and the European Commission expects it to stay there through 2027. France’s is 5.1% and is forecast to widen to 5.7%. Interest payments alone are set to climb from 2.6% to 2.8% of French output over the same two years.
Add a parliament that cannot agree a budget and a presidential election in 2027 with no obvious outcome, and lenders have decided that French promises are the ones most likely to be rewritten. Italy, for all its debt, has had the same prime minister and the same fiscal line for four years.
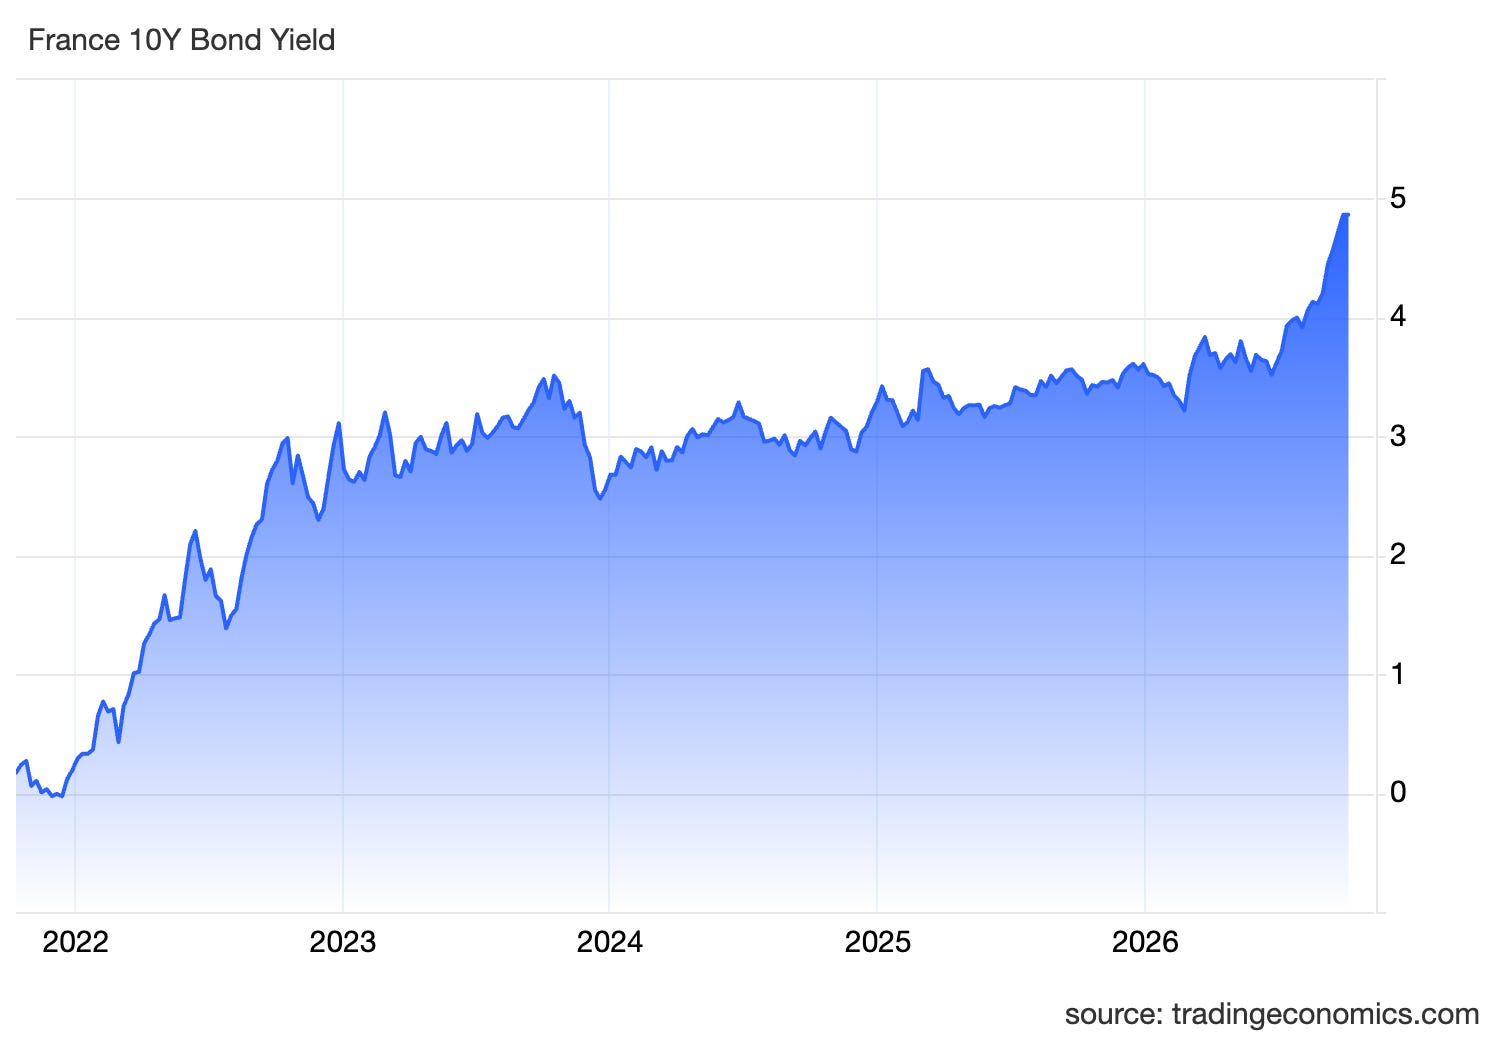
The strange part is in the corporate market. Air Liquide sold €2 billion of bonds on Tuesday, took €12.5 billion of orders, and priced both of its fixed-rate tranches below the French government curve. Bloomberg counts €215 billion of French high-grade corporate debt now trading through the state, against €12 billion in January — an eighteen-fold rise in nine months.
A lender doing that is saying that L’Oréal’s cash from Asia and America looks more dependable over ten years than the French Treasury’s ability to collect taxes. Where a company earns its revenue matters more than where its head office is registered. French banks are the exception, because their balance sheets are full of French government bonds, and insuring their debt now costs more than insuring other European lenders’.
Keep it in proportion. France has no funding problem: the auctions clear, the buyers turn up, and 4.8% for ten years when America pays 5.24% is an expensive price rather than a distressed one. Spreads like this have lasted years elsewhere without anything breaking. The thing worth watching is not the yield but whether that €215 billion keeps growing.
2. Sixty-five billion dollars of loans nobody wants
A leveraged loan is money lent to a company that already carries a lot of debt, then sliced up and sold on to funds. JPMorgan counted the American ones trading below 60 cents on the dollar, which is the market’s way of saying it expects to get back considerably less than it lent. The total is $65 billion, up from $40 billion a year ago and the highest since March 2020.
Widen the definition to loans at or below 80 cents and the pile is $139.8 billion, nearly double twelve months ago and about $4 billion short of the peak reached in May 2020. The number of borrowers in that category has gone from 106 to 141.
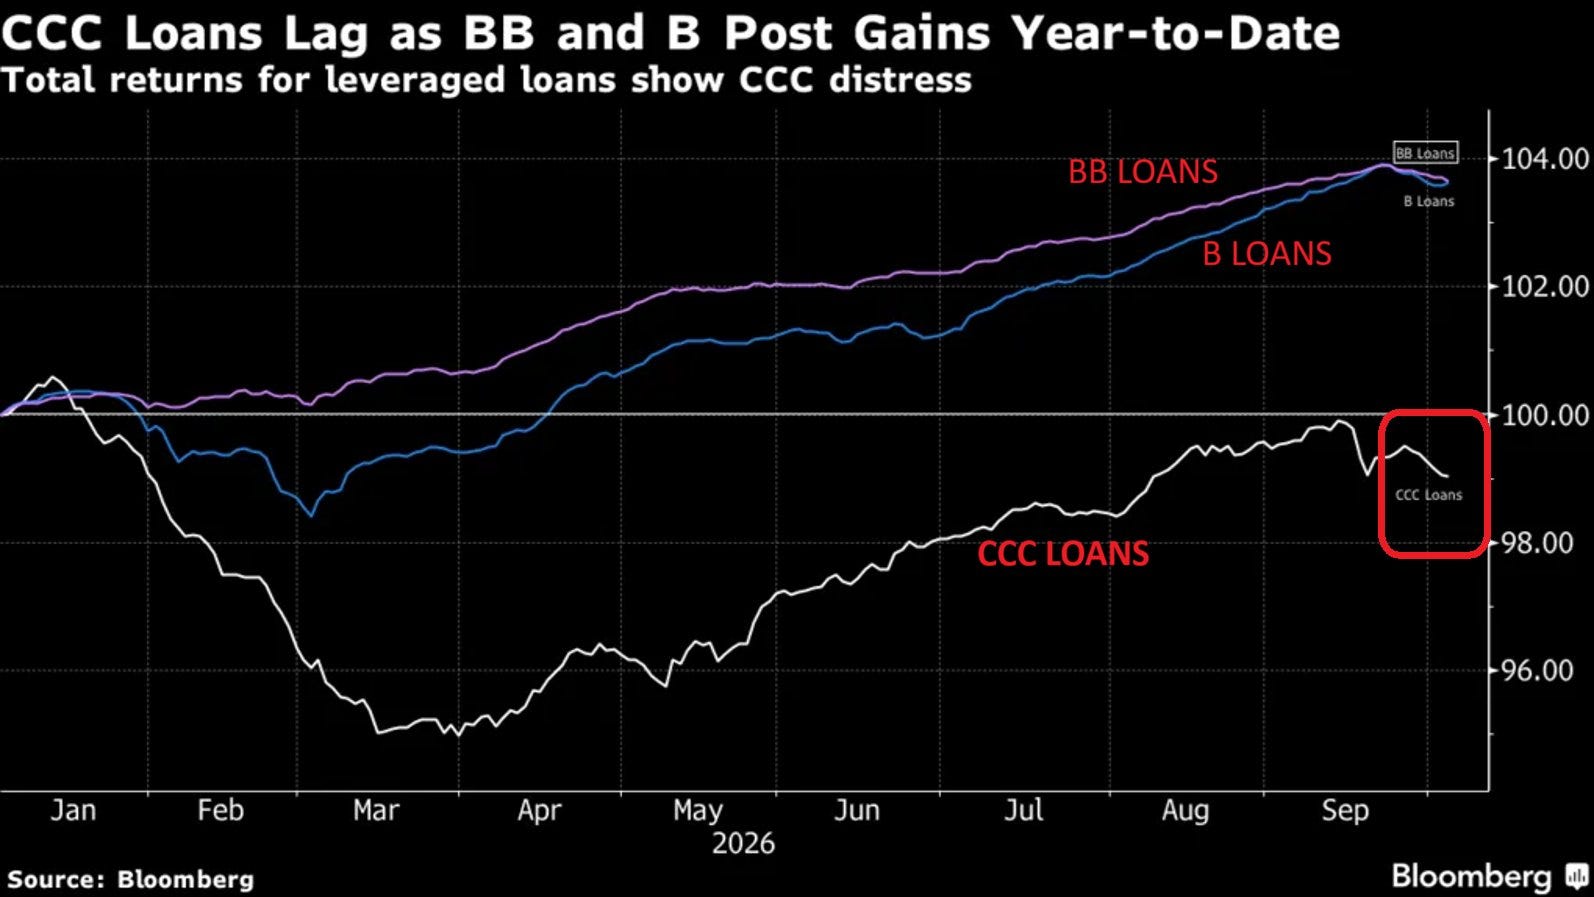
The mechanism is plain. These loans pay a floating rate: a base that tracks what the central bank does, plus a fixed margin on top. A company that borrowed in 2021 when the base was near zero now pays a base near 4%, and Wednesday’s minutes said another rise is likely. Nothing about the underlying business has to get worse for the interest bill to double.
Technology is 39% of the distressed pile, or $54.4 billion, and software companies face more than $100 billion of debt coming due. That is the same sector the stock market is paying record multiples for. CCC-rated loans, the lowest rung of junk, are down 1.97% this year while every other junk category has made money, which is the market sorting borrowers one by one rather than selling the asset class.
Jamie Dimon spent the week warning that corporate credit will get dearer. JPMorgan’s own forecast has loan defaults rising from 2.25% this year to 4.50% next.
Against that: the troubled share of the American loan market is still around 5%, most of these companies are privately owned by funds with money to inject, and American corporate borrowing actually got cheaper this week. This is a slow problem concentrated in one sector.
3. A record index in an unhappy country
Tuesday’s S&P 500 close of 7,818.93 was an all-time high. The median stock inside that index is about 16% below its own one-year high. Goldman Sachs says its breadth indicator — how many shares are rising together — is close to the lowest since the dot-com peak.
Across the wider Russell 3000, 51% of companies are down more than 20% from their June highs, against just over 40% two weeks earlier. Semiconductors are worst at 96% of the sector in that state, software next at 75%. The ten largest companies in the S&P 500 now account for about 40% of its market value and 37% of its expected earnings. At the 2000 peak the top ten were 27% of value and 15% of earnings — today’s concentration is bigger, and the earnings behind it are real.
Hedge funds have been piling into exactly that trade. Goldman’s prime brokerage desk puts their net exposure to the seven big technology names at a record 22% of their American holdings as of 5 October, up from 15% in July.
Away from the screens the mood is worse than the index suggests. The University of Michigan’s first October reading of consumer sentiment came in at 46.3, the second-lowest in the survey’s history. Its measure of how households see conditions right now fell to 44.7, the worst ever recorded. Joanne Hsu, who runs the survey, put it down to prices and borrowing costs making big purchases feel out of reach, and called households’ expectations “largely stagflationary”.
The Federal Reserve’s three-yearly Survey of Consumer Finances, published Friday, says the same thing with harder numbers. Nearly 20% of American families reported falling behind on a loan payment in the three years to 2025, up from about 12% in the previous survey and the highest since 2010. More than 8% were two months late or worse. The share spending over 40% of their income on debt payments reached 8.6%, the most since 2013. Real median family income rose 7% across the same period.
Two things went genuinely well. Nobody is being laid off: initial jobless claims fell to 197,000, a fifth straight weekly decline and the lowest since July. And American companies had a good week in the debt market, with high-yield borrowing costs falling nine basis points and investment-grade four.
Data Check
Seven releases mattered, and five of them came in short of what economists expected.
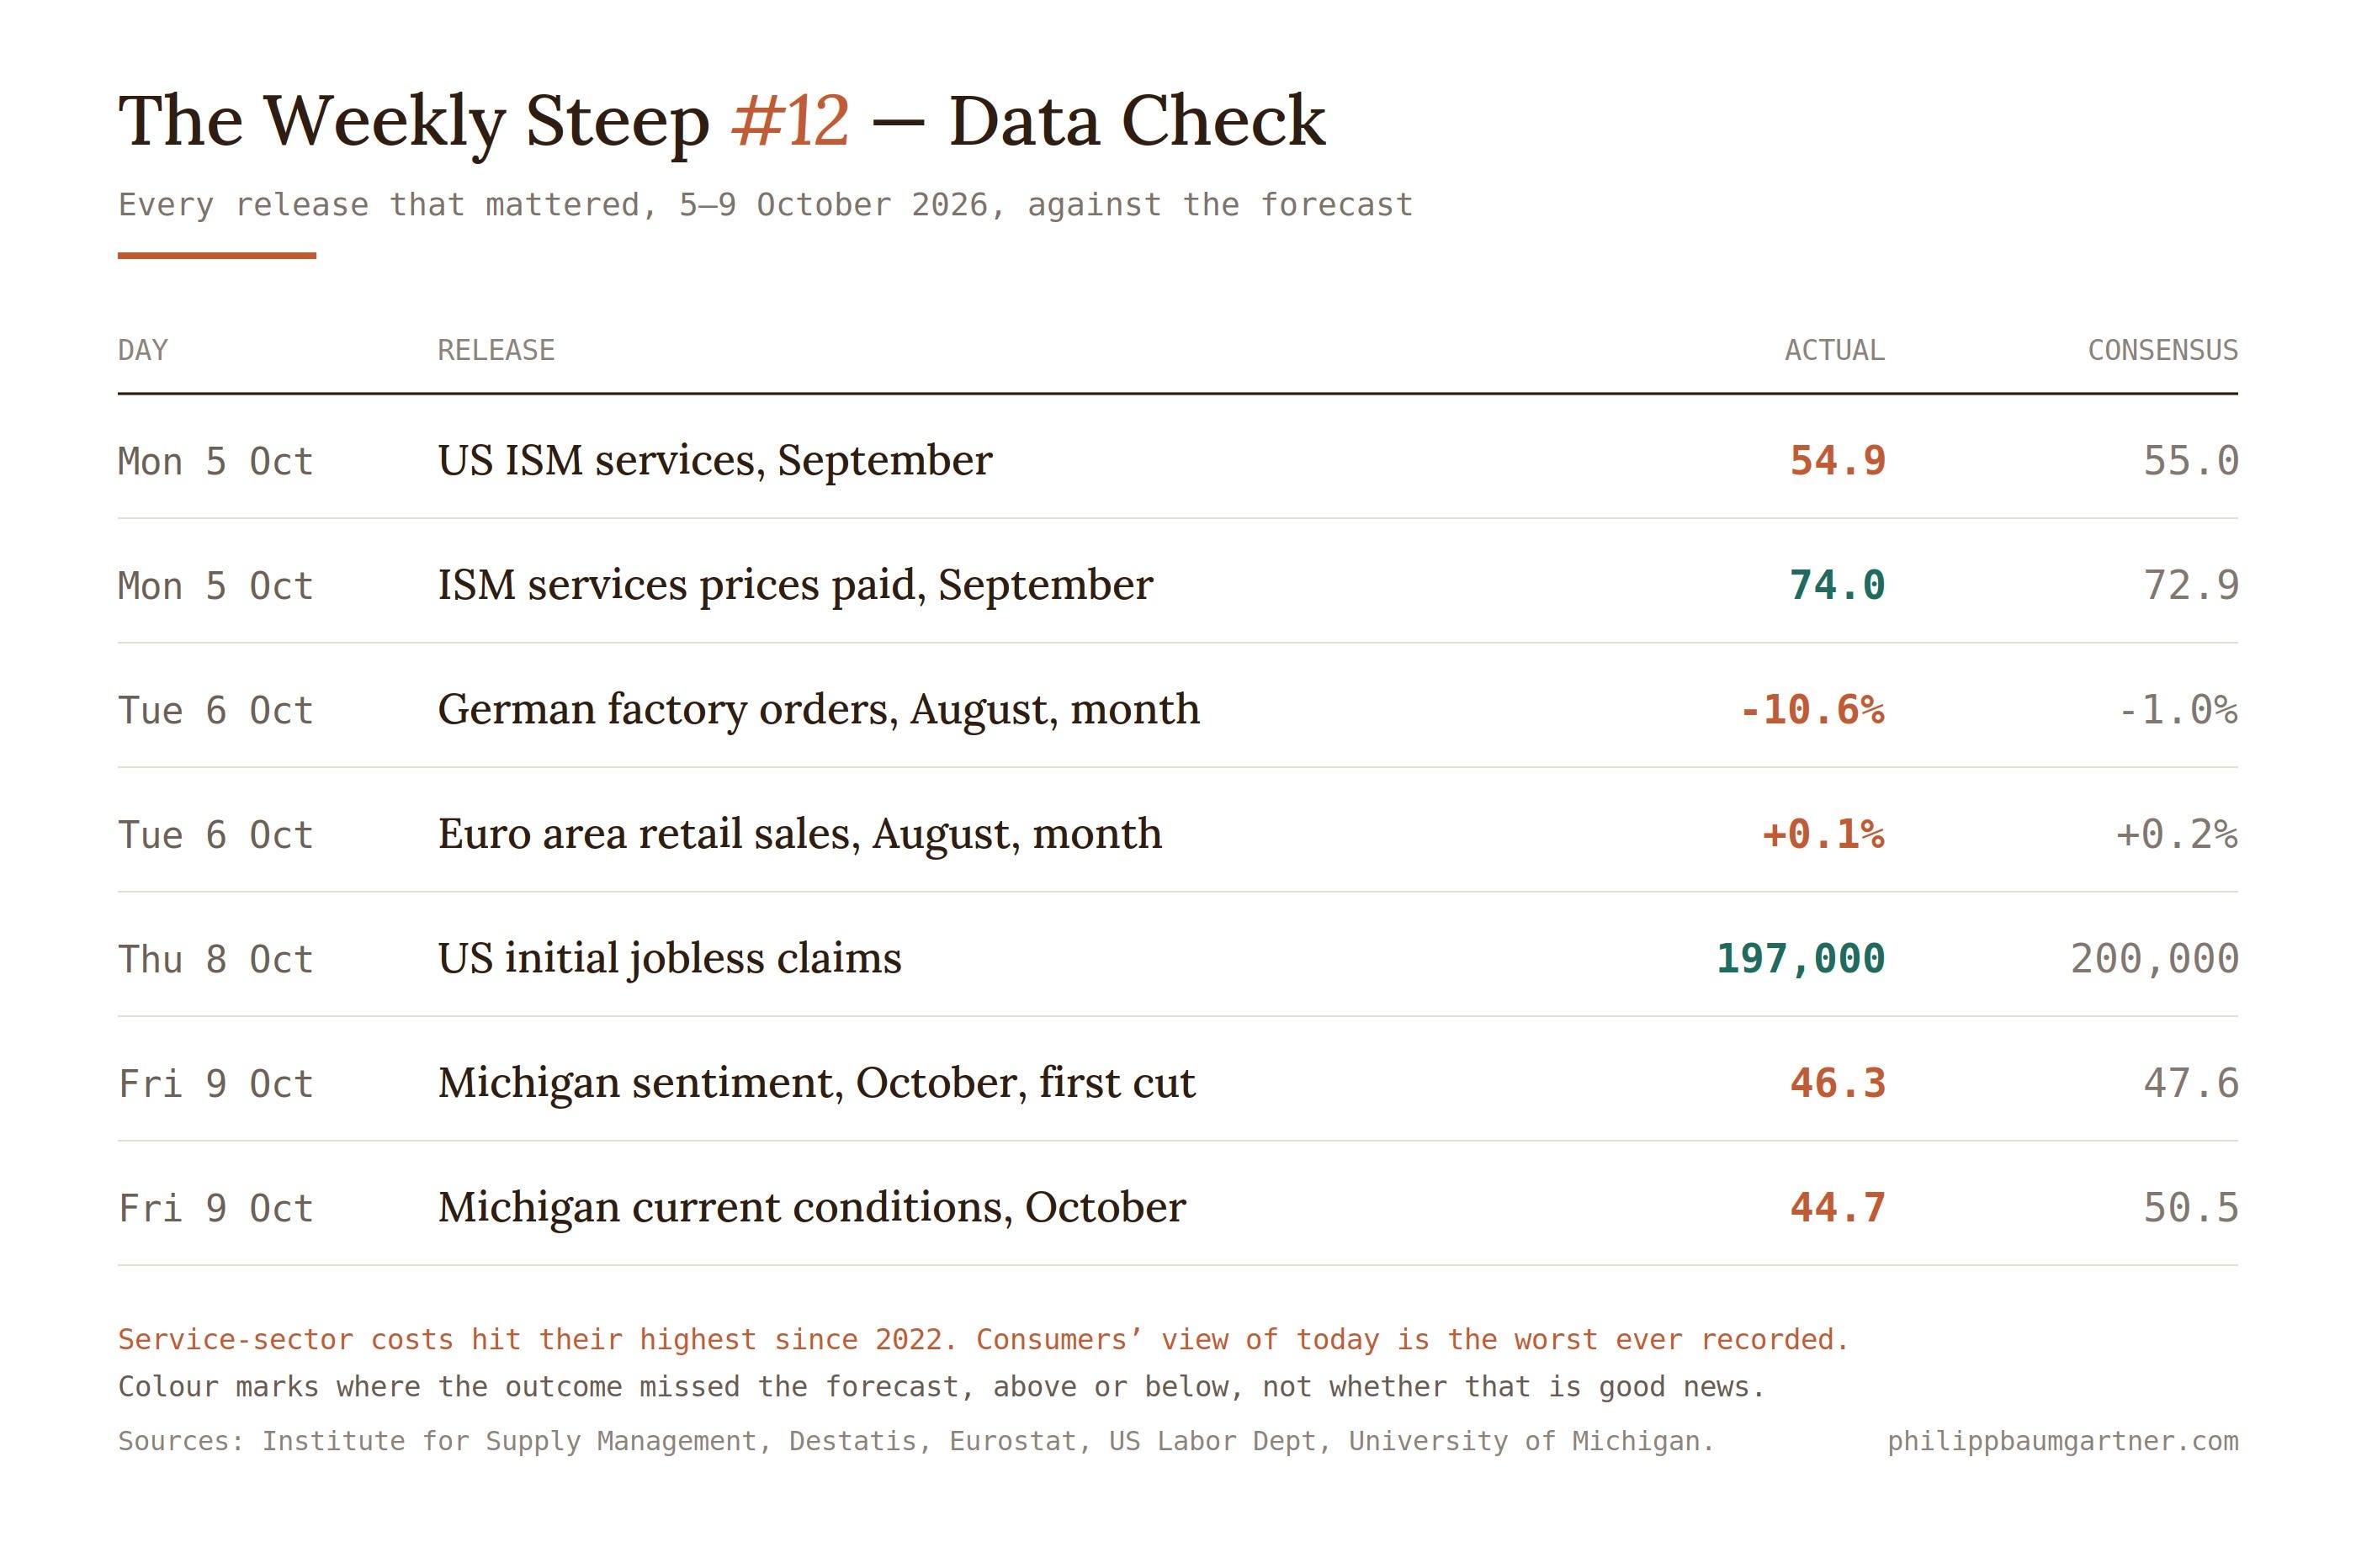
The German row needs disarming before anyone panics. Factory orders fell 10.6% in a single month, the sharpest drop since January, and almost all of it came from one line: orders for aircraft, ships and trains collapsed 61.5% after more than doubling in July on a handful of enormous contracts. Strip out the large orders and German manufacturing was down 0.1%. Nothing happened.
The American service survey is the row that matters. The headline slipped to 54.9, still comfortably in growth, but the sub-index tracking what service companies pay for their inputs rose to 74.0, the highest since 2022. Oil is the obvious culprit. Energy costs reach manufacturers and hauliers first and service firms a month or three later, and service prices tend to stay where they land, because they sit inside wage agreements and leases and fee schedules that reprice slowly.
That single number explains why the Fed minutes read as they did, why Michigan’s one-year inflation expectation climbed to 4.7%, and why the market still gives December a high chance of another rate rise.
The Credit Grind
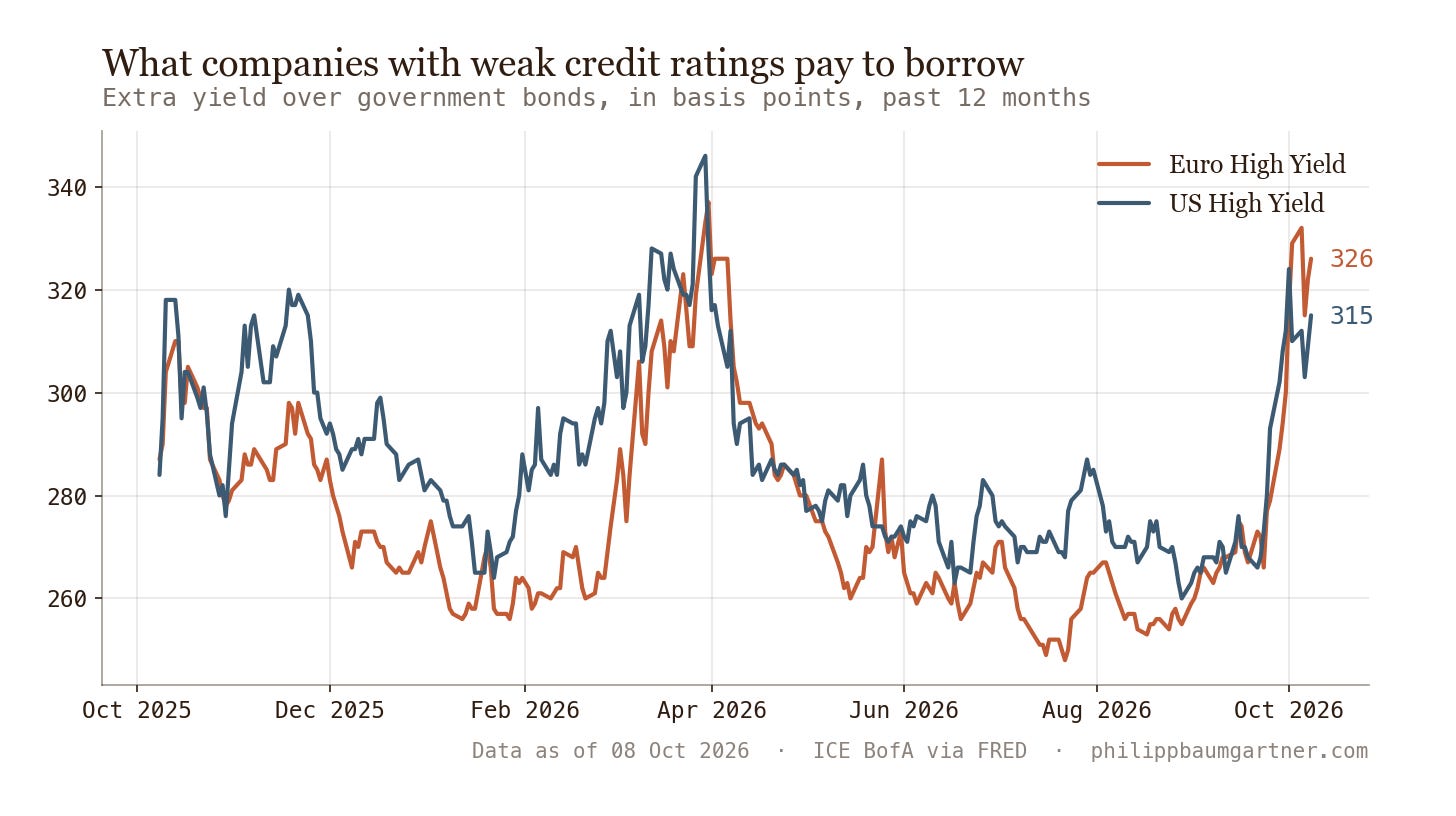
For the first time since this letter started tracking it, European junk borrowers pay more than American ones. The gap between the two high-yield indices flipped from −7 basis points a week ago to +11 now, as Europe widened nine and America narrowed nine.
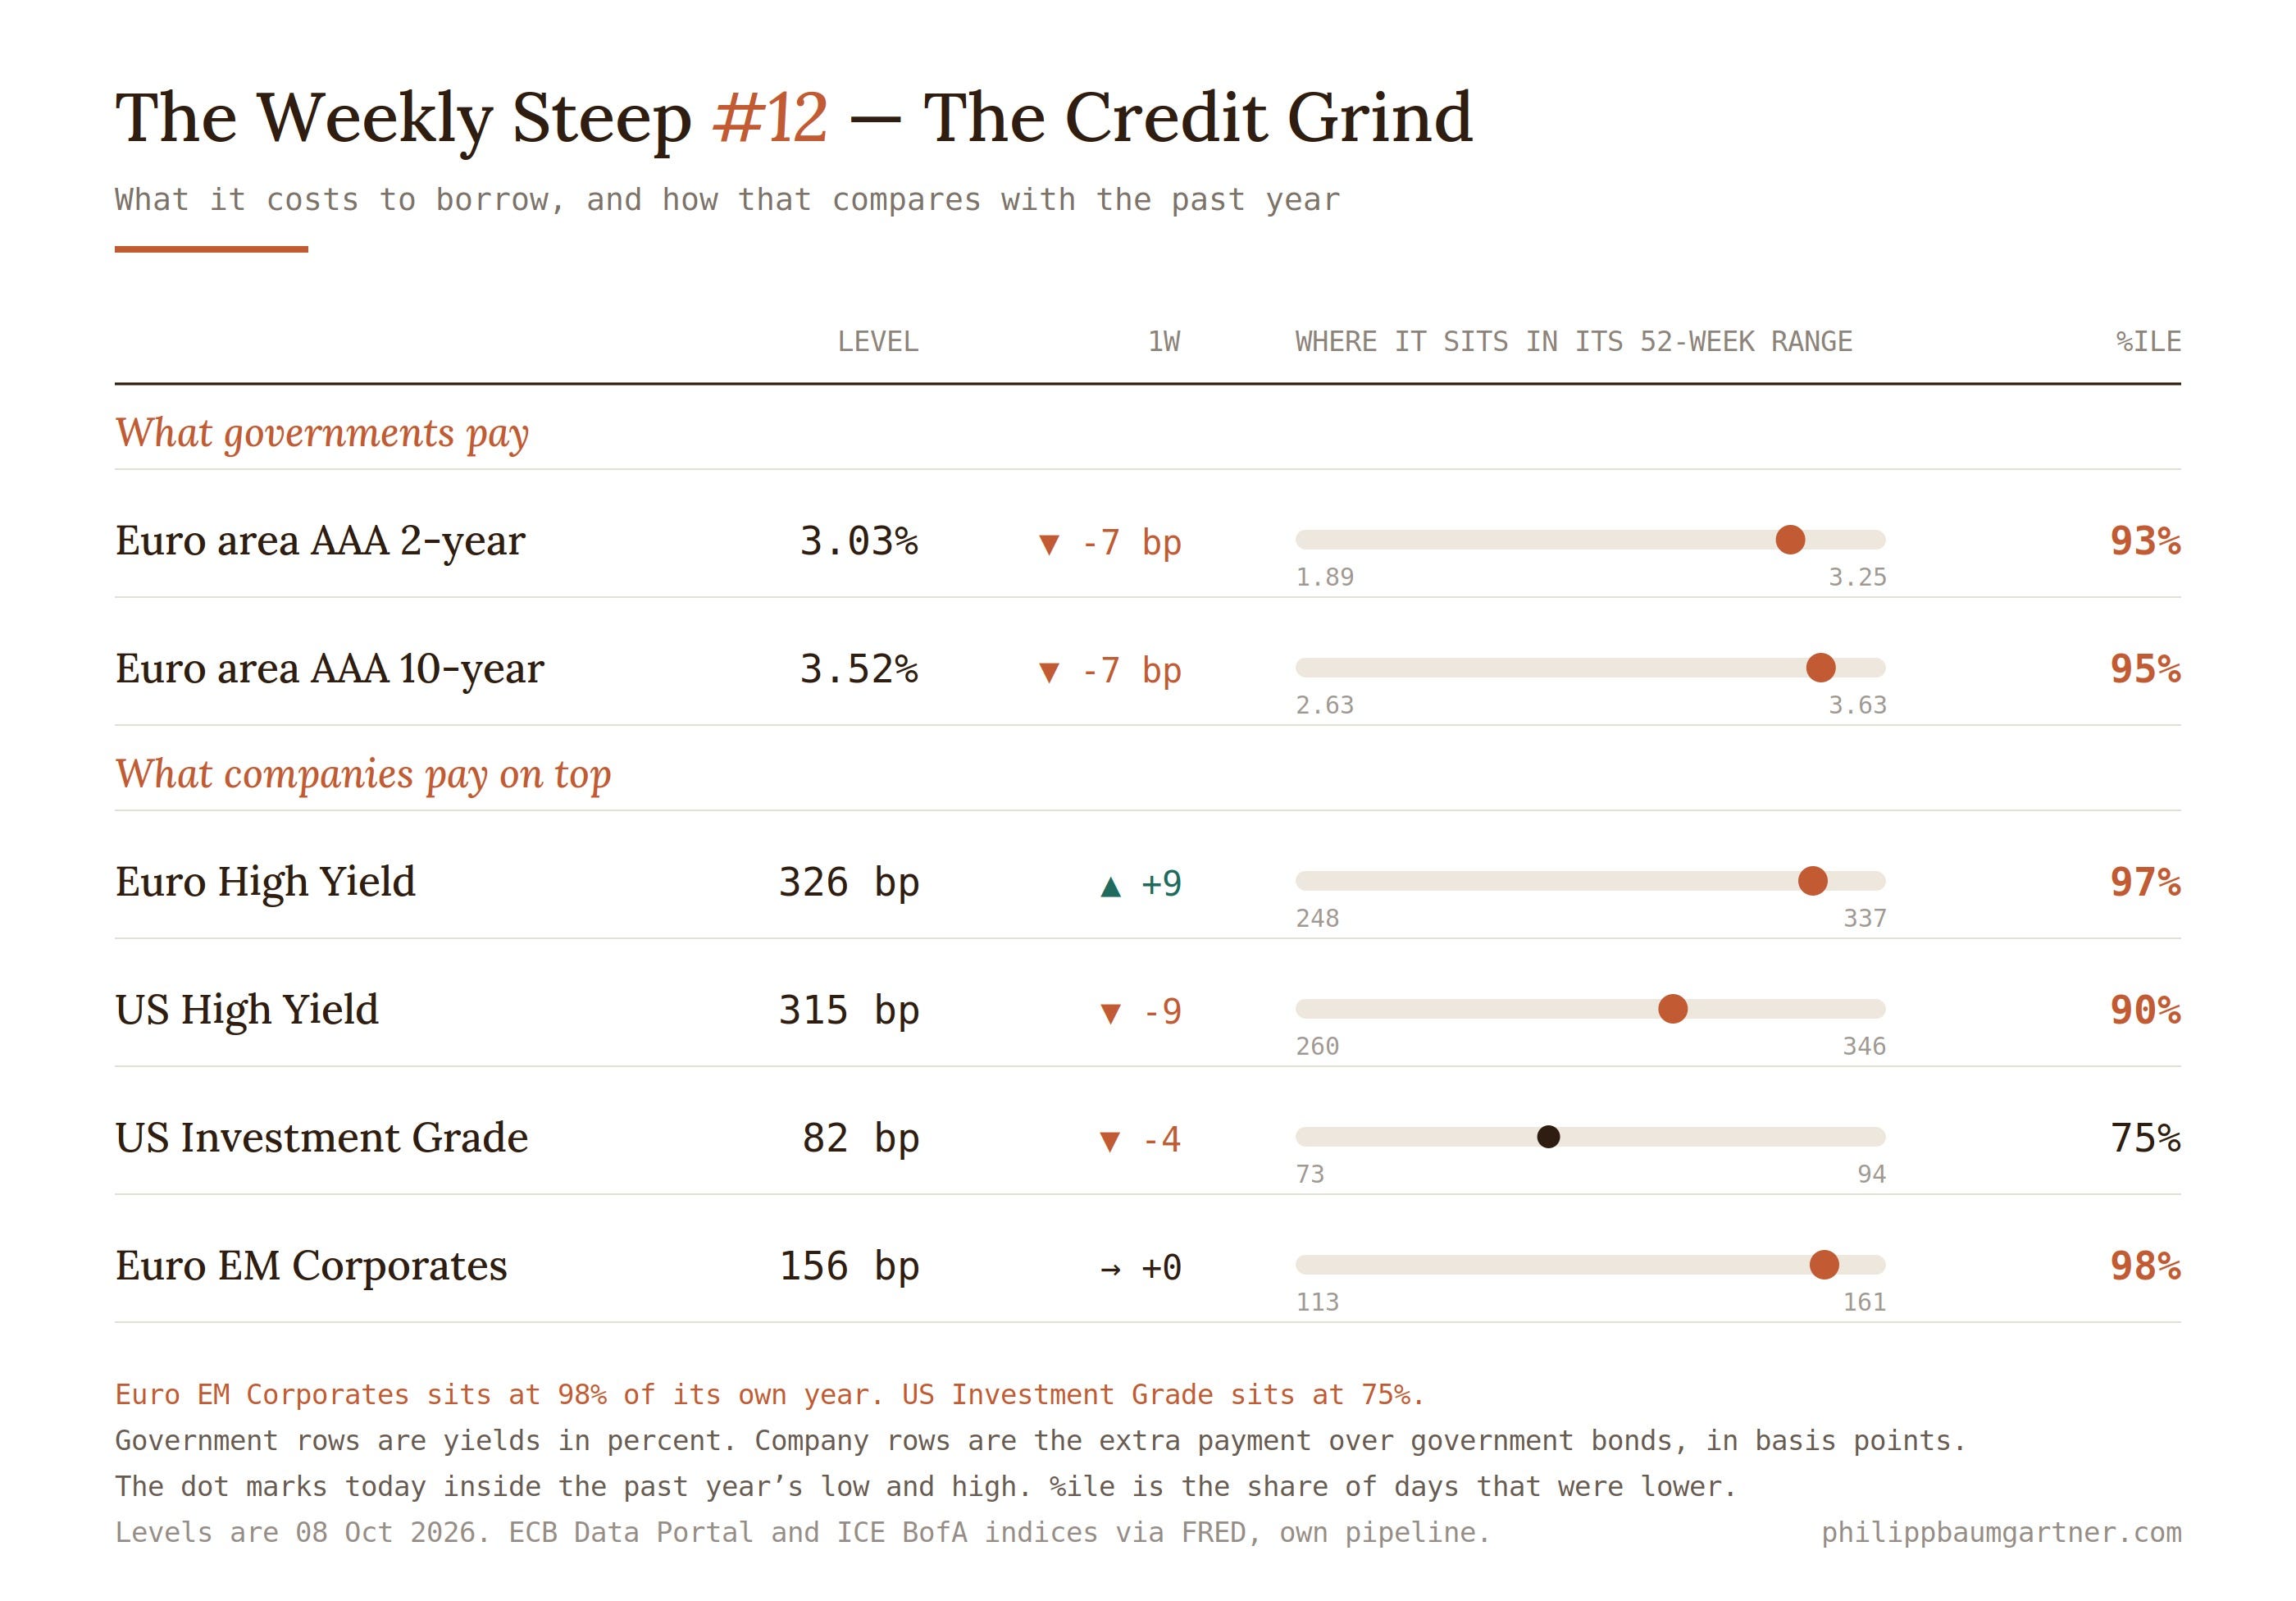
Anyone lending to a company is paid for two things. One is the price of money itself, which governments set. The other is compensation for the chance this particular borrower stops paying, and that second part is what the company rows measure, in basis points on top of the government rate.
Europe’s high-yield borrowers now pay 326 basis points on top, which is 3.26 percentage points and sits at the 97th percentile of the past year — higher than on all but a handful of days since last October. America’s pay 315, and that sits at the 90th. The quietest number on the board is American investment grade at 82 basis points, back down at the 75th percentile after last week’s jump, which is to say large solid American companies are borrowing at ordinary prices again.
The flip has a tidy explanation. France is Europe’s second-largest corporate bond market, and when the French state’s own borrowing cost rises and its budget stalls, European credit gets marked down alongside it. America has the reverse: an expensive government and companies that looked relatively good against it all week.
The government rows underneath moved together for once. Euro-area two-year and ten-year borrowing both fell seven basis points, leaving the gap between them at 49 basis points, unchanged on the week. A curve that keeps its shape while everything above it is repricing tells you the European Central Bank is not the story here. What companies pay on top of it is.
The Onchain Pour
Friday was the first anniversary of 10 October 2025, the day a record $19 billion of crypto positions were force-closed in a single session. The market marked it in character. About $1.2 billion of positions were liquidated in the twenty-four hours to Thursday evening, roughly 90% of them bets that prices would rise, with 191,736 accounts caught.
Ether took the heavier beating. Measured against the size of each market, ether positions were wiped out at roughly six times bitcoin’s rate — about $1.2 million of liquidations per billion dollars of market value, against $180,000 for bitcoin. Ether ended the week at $2,488, down 7.9%. Bitcoin closed at $82,123, down 4.5% after touching $80,400 on Thursday.
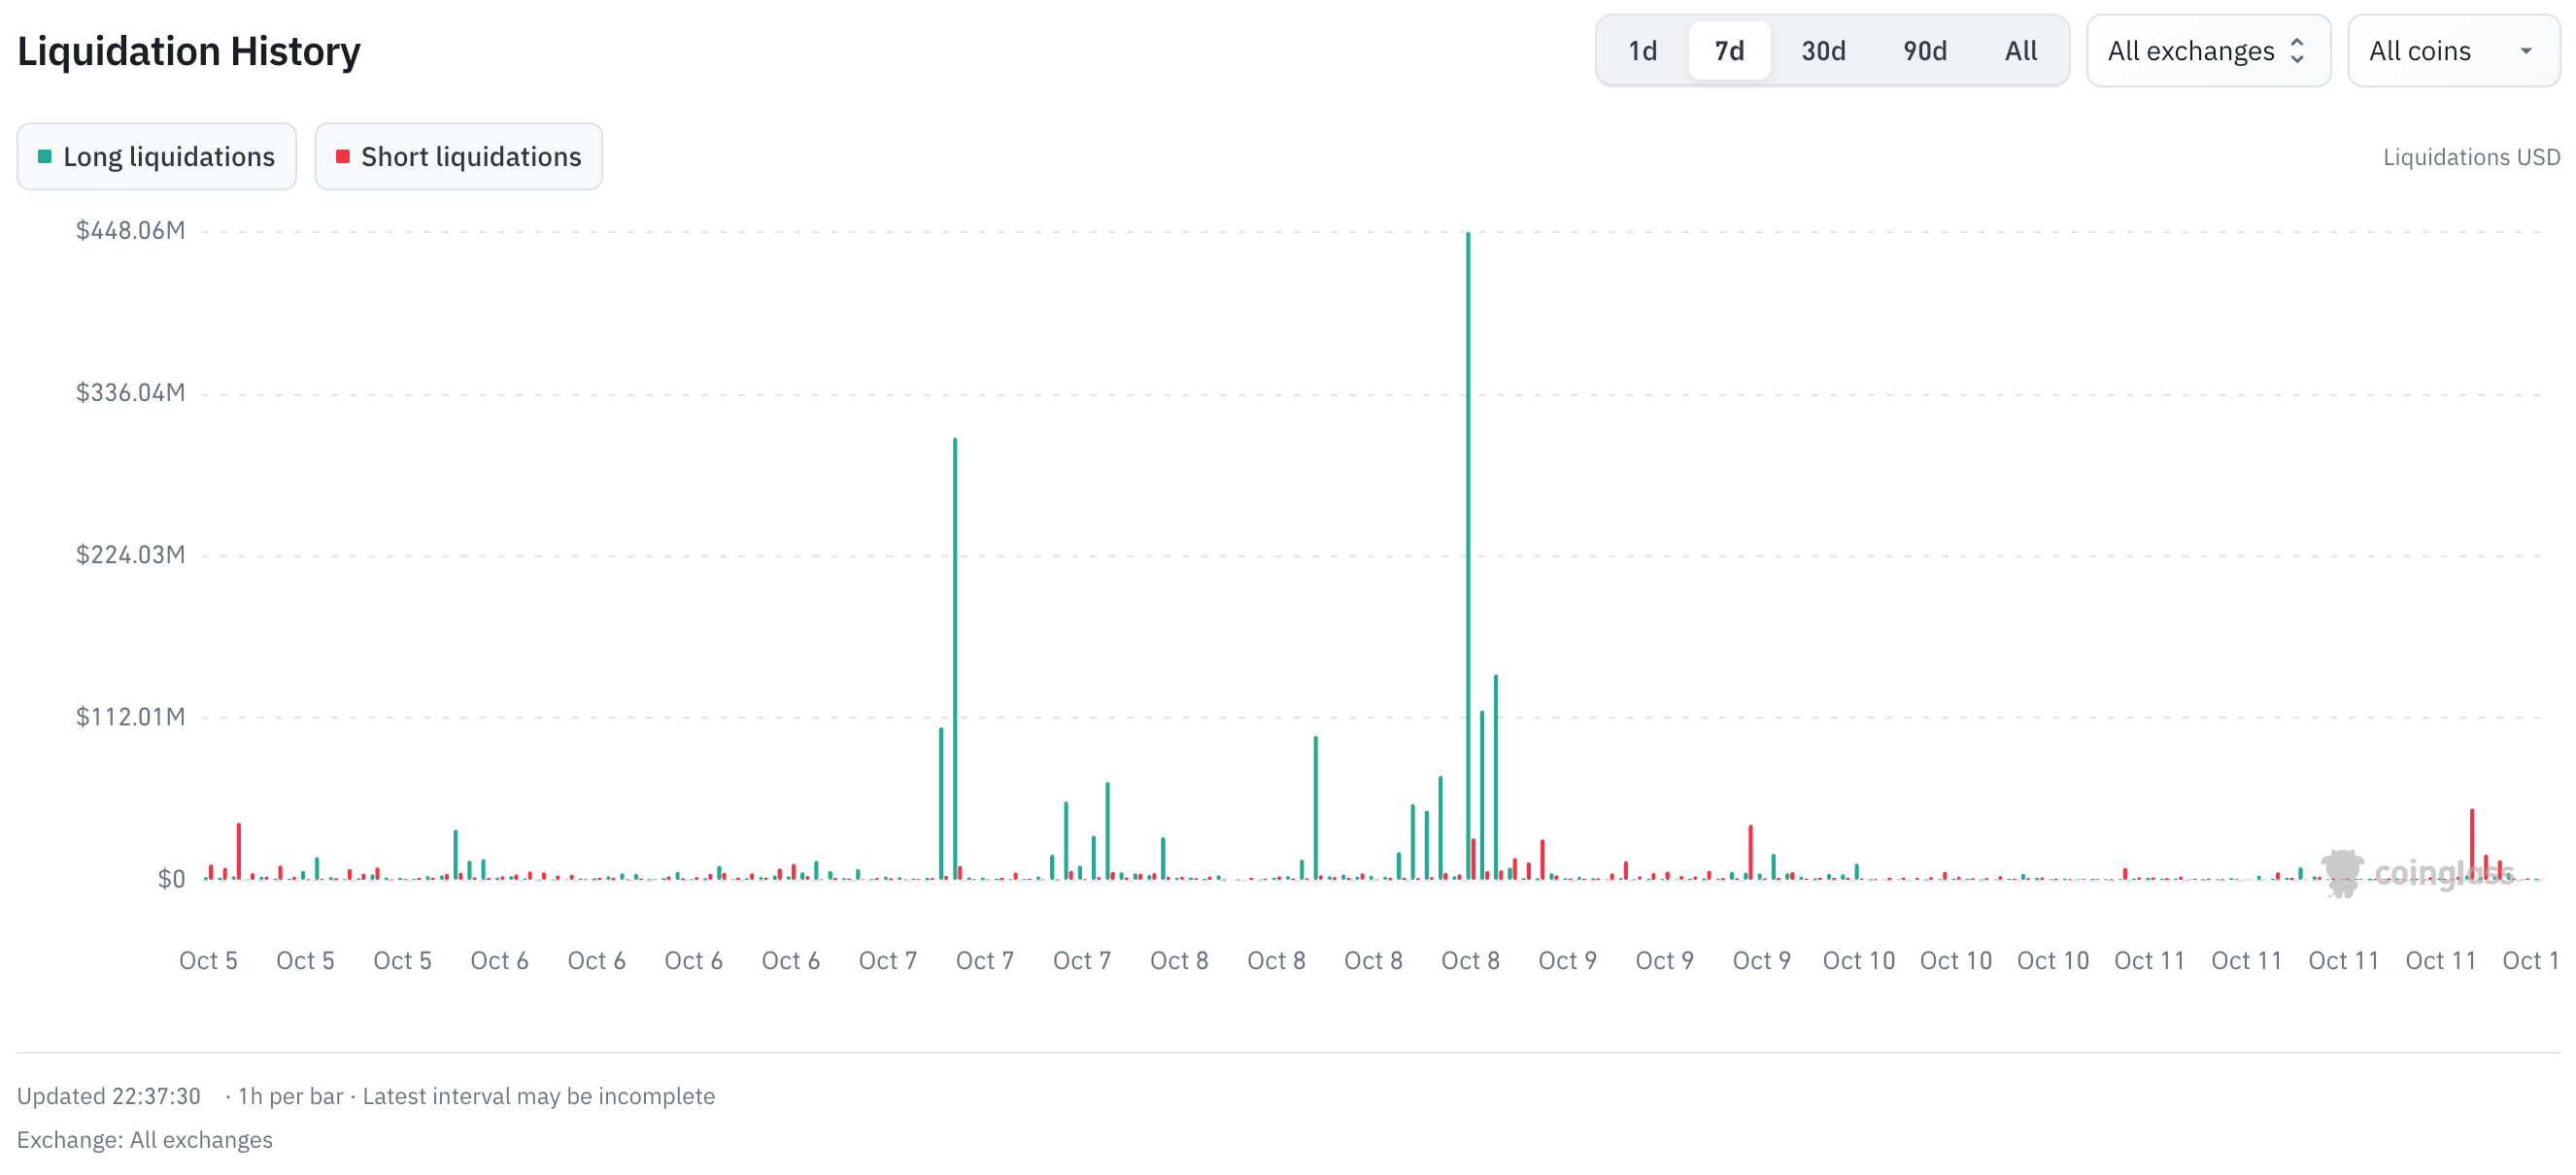
The useful part is what did not happen. CoinDesk Research measured how much money sits in the order book ready to absorb a sale and found bitcoin’s depth within 1% of the price at about $11.7 million, roughly 75% above where it stood on crash day — and that with bitcoin itself about a third cheaper, so those dollars represent considerably more committed capital. Ether’s depth has more than doubled. Market makers came back to the two big coins and stayed through Thursday.
They have not come back to anything else. Depth across the broader basket of alternative coins is down about a third since early 2025, and weekly spot volumes across exchanges average $279 billion, well under half the level of the crash week. The market got sturdier at the top and thinner everywhere below it. Thursday was a reminder of what the second half of that sentence costs.
The Week Ahead
Wednesday is the week. American consumer prices for September land at 14:30, into a market that has spent a fortnight arguing about whether the Federal Reserve moves again this month, in December, or not at all. September already delivered a quarter-point rise to 3.75–4.00%, unanimously, and the minutes published this week said most of the committee expects another before the year ends. Futures give October about one chance in four and December roughly five in six.
What makes this reading awkward is the gap between its two halves. The core measure, which strips out food and energy, is expected to behave. The headline measure, which does not strip them out, has oil running 66% higher than a year ago sitting underneath it. A central bank watching the core can afford to wait. A central bank watching households’ inflation expectations climb to 4.7% has less room.
Earnings season starts the day before, which gives the week a second axis. The big American banks report first, and what they set aside for bad loans will be read as a verdict on everything in chapter two of this letter.
US bank earnings — Tuesday, from 12:00.
JPMorgan, Goldman Sachs, Citigroup and Wells Fargo on Tuesday, Morgan Stanley and Bank of America on Wednesday. Analysts expect financial-sector earnings up about 3% on the year. The lines worth reading are loan-loss provisions and anything said about leveraged lending.
China consumer prices — Wednesday, 03:30.
Consensus 0.9–1.0% after 0.8%. Factory-gate prices expected unchanged at 3.8%, which matters for everything the rest of the world imports.
US consumer price inflation — Wednesday, 14:30.
Consensus +0.6% on the month, lifting the annual rate to 3.6% from 3.4%. Core expected at +0.2% and 2.5%. A core print of 0.3% or higher puts an October rise back on the table; 0.1% or lower pushes the whole argument to December.
Federal Reserve Beige Book — Wednesday, 20:00.
The anecdotal survey of the twelve regional banks. Worth reading for what companies say about passing costs on, which is the question the ISM prices index raised on Monday.
UK GDP, August — Thursday, 08:00.
Consensus a fall of 0.3% to 0.4% after two readings of +0.4%.
US retail sales — Thursday, 14:30.
Consensus +0.3% after +1.1%. The Chicago Fed reckons that once inflation is removed the real figure is nearer −0.7%. With sentiment where it is, this is the test of whether American households are still spending anyway.
US producer prices — Thursday, 14:30.
Consensus +0.5% on the month, annual rate easing to 5.3%. Producer prices are where the oil pass-through shows up before it reaches consumers. Jobless claims at the same time, consensus 197,000.
Euro area final inflation, September — Friday, 11:00.
A confirmation rather than news, though the country detail matters for the French story above. Euro area industrial production for August lands Thursday at 11:00.
☕ Last Sip
Two facts from this week belong in the same sentence. A stock index at a record high, and the worst reading on how Americans see their own finances since that survey began. Both are true at once because they describe different populations. The ten companies carrying the index and the twenty per cent of families who missed a loan payment do not overlap much.
France found itself in the same shape in miniature. Its blue-chip exporters borrow more cheaply than its treasury, because they sell to the world and the treasury can only tax France.
What connects them is sitting at $104 a barrel and up two thirds in a year, feeding service-sector costs in America, inflation expectations everywhere, and the rate path that decides what both kinds of borrower pay next. Wednesday’s number tells us how far along that chain we are.
Enjoy the rest of the weekend. See you next Sunday.
Sources
Market levels from Trading Economics, the Washington Post’s index summary, ANSA for the Italian–German spread, and Seoul Economic Daily for the KOSPI, whose close is Thursday’s because Seoul was shut on Friday. Economic releases from the Institute for Supply Management, Destatis, Eurostat, the US Labor Department and the University of Michigan. Credit and euro curve data from ICE BofA indices via FRED and the ECB Data Portal, as of 8 October. The French, leveraged loan and market breadth figures come from Bloomberg, JPMorgan and Goldman Sachs respectively; onchain data from CoinDesk Research and CoinGlass. Weekly changes are measured against the levels published in edition #11. Analysis and personal opinion — never investment advice.