

Where this all started
This paper started with a single sentence. Mark Connors, who has come to serve as a mentor to me in the macro space, pointed out that roughly a third of US Treasuries now sit in short-term paper. I went into the Treasury’s records to verify it, and found something even better: the precise number is more interesting than the round one, and the story behind it is bigger than the statistic. What follows is that story, condensed to one page first.
The situation.
A third of all US marketable debt, 10.1 trillion dollars, matures within the next twelve months. The government repays none of it out of revenue. It sells new paper to redeem the old, week after week, at whatever rate the market demands that day. I computed these figures from the Treasury’s security-level records myself and cross-checked them against the official totals to within four billion dollars.
The choice.
This structure was built, deliberately. Treasury bills, paper shorter than one year, make up 21.5 percent of the stock, above the 15 to 20 percent band the Treasury’s own advisors recommend, and 85 percent of everything currently being issued. The United States has financed itself like a floating-rate borrower: it profits within weeks from every rate cut and pays just as fast for every hike.
The cost.
The average interest rate on the debt doubled in five years, from 1.54 to 3.35 percent, because a third of the debt reprices every year. Net interest now runs 3.5 billion dollars per day, more than the entire defense budget.
The buyers.
Demand remains strong, with nearly three dollars of bids for every dollar of short paper sold. Who provides it has changed: foreign central banks stepped back, money market funds and stablecoin issuers stepped in, the latter required by US law to hold exactly this paper.
The argument.
By financing short, the United States has wired its budget directly to the Fed’s next decision. That wire is a transmission channel rather than a crisis, and it is the most useful lens available for reading every rate meeting, every refunding announcement, and every auction from here on.
Chapter 1: The number worth understanding
The United States owes 39 trillion dollars. That number gets quoted constantly and explains almost nothing. It is too big to feel, it grows every day by design, and on its own it carries no information about risk, cost, or timing. A household owing 500,000 dollars on a thirty-year fixed mortgage and a household owing 500,000 dollars on a credit card are not in the same situation, even though the headline number is the exact same. What really matters and makes the difference is the structure of the debt. When it comes due, what it costs, and how fast that cost can change.
And here comes a number that carries some very spicy information. 10.1 trillion dollars of US government debt comes due within the next twelve months. Due means what it means for any loan. The money has to be repaid on a fixed date. That is 32.6 percent of all the debt the US government has issued to its investors. So essentially a third of the American debt has a clock attached to it with less than a year maturity. I computed this number from the Treasury’s own records, which list every outstanding security with its amount and its due date, and cross-checked my total against the official summary statistics. The two match to within four billion dollars on a base of 31 trillion, which in this world counts as exact. Apollo, one of the largest asset managers, puts the same figure at 33 percent. The government’s own auditors report that 9.1 trillion dollars of maturing debt had to be refinanced in fiscal year 2025 alone. This means that a third of the debt rolls over inside a year.
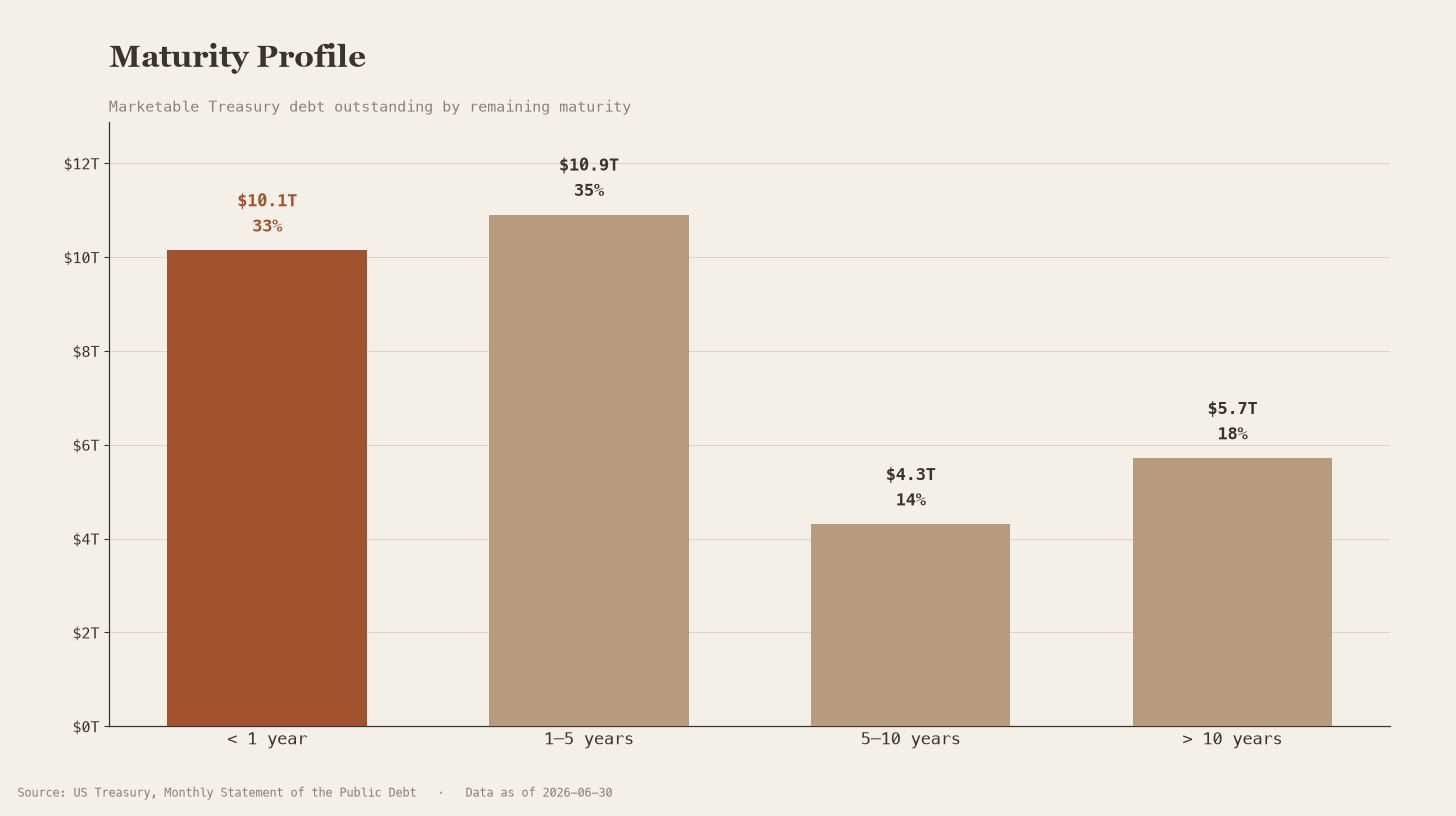
Marketable Treasury debt by remaining maturity, June 2026 · Source: US Treasury MSPD
The chart shows the full picture, and it is worth a moment. The two left bars carry the most weight. As one can see a third of the debt matures inside one year, another third between one and five years. Together, two thirds of everything the United States owes gets repriced within five years. Most people picture government debt as the opposite: long, patient bonds that were sold decades ago and will not bother anyone for decades more. The chart shows how little of the debt actually works that way. The paper beyond ten years, the image everyone carries in their head, is the smallest of the four bars. The everyday reality of American debt is the tall bar on the left, and it comes due within the year.
The same debt, cut by calendar year instead of bucket, makes the shape even clearer.
The wall stands at the front, and the thin tail running to 2056 is all that carries the famous long average.
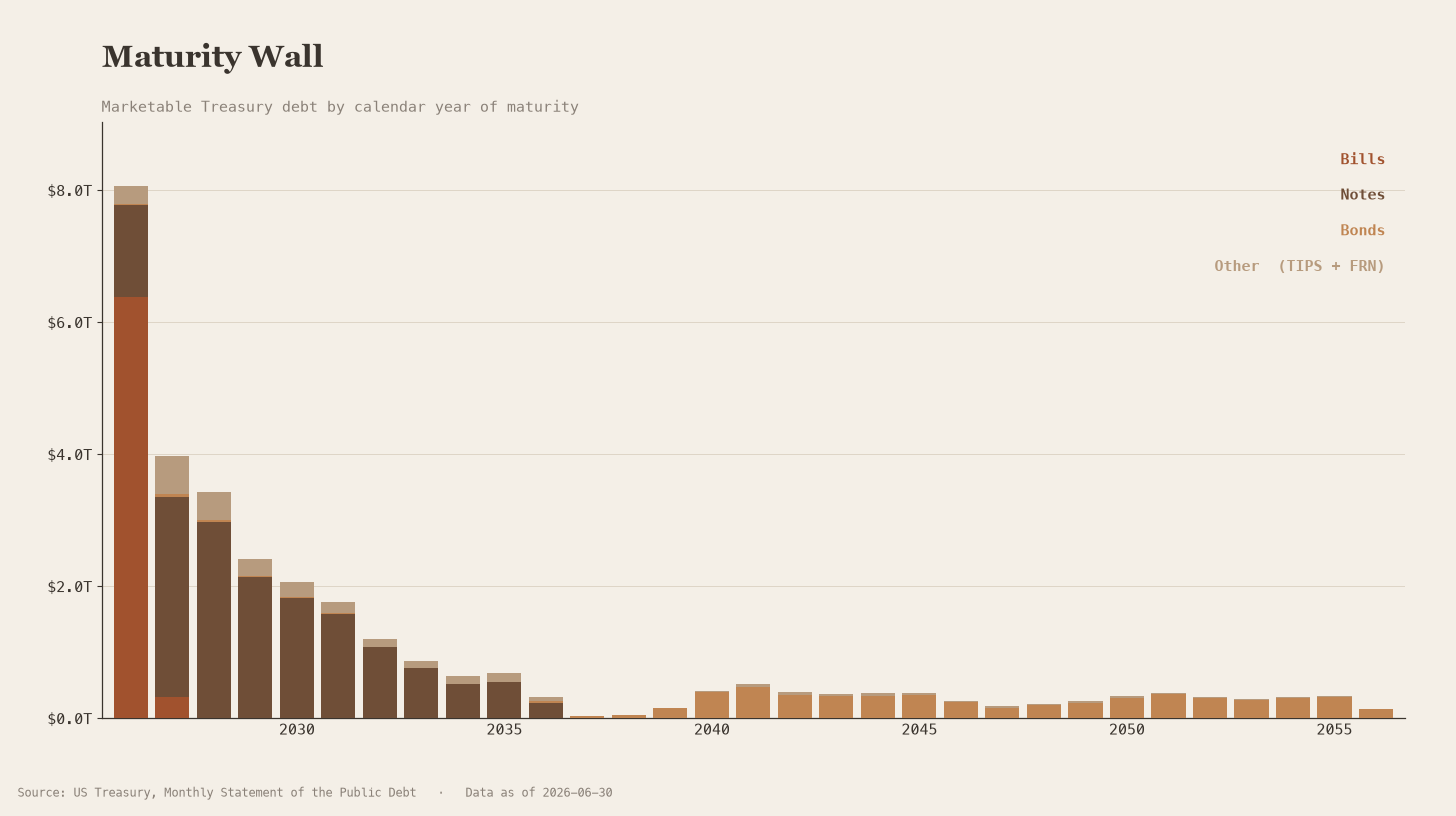
Marketable Treasury debt by calendar year of maturity, 2026–2056 · Source: US Treasury MSPD
Why that matters, and why it is neither an accident nor an automatic catastrophe, starts with what this debt actually is.
Chapter 2: What the government actually sells
When the US government spends more than it collects in taxes, it borrows the difference by selling securities. This happens via standardized IOUs. IOU is short for “I owe you” and describes a written note that acknowledges a debt between two parties. You give the government money today, it repays you on a fixed date, and you earn interest for lending out your money and waiting. These IOUs come in three main forms, and the only real difference between them is how long you wait.
Treasury bills are the short ones, running from four weeks to one year. Bills pay no interest along the way. You buy them at a discount, say 98 dollars for a bill that repays 100, and the 2 dollars of difference is your return. Because the wait is short, bills are the closest thing on earth to cash that pays.
Treasury notes run from two to ten years and pay interest every six months. The ten-year note is the one quoted in every news segment, the benchmark for mortgages and corporate borrowing worldwide.
Treasury bonds run twenty to thirty years, on the same schedule, and are bought mostly by institutions with obligations decades out: pension funds, insurers, sovereign reserves.
The government sells this paper at auctions, and an auction means what it always means: investors bid, and the interest rate the government ends up paying is whatever buyers demand that day. Nobody decrees the rate. The market sets it, fresh, at every auction. The Treasury runs these auctions on a published calendar, week in and week out, in sizes that would count as a major corporate bond deal anywhere else and here are simply Tuesday.
One more piece. The Federal Reserve sets a short-term policy rate, and that rate anchors what investors demand at bill auctions, because a bill competes directly with parking money at rates the Fed controls. Raise the policy rate and bill auction rates follow within days. Cut it and they follow just as fast.
Long bonds, by contrast, price on expectations about growth, inflation, and policy over the coming decades, and respond far more loosely to any single Fed decision. This asymmetry between the short and the long end carries the entire story: whoever borrows short has tied their costs to the central bank’s next move, and whoever borrows long has bought independence from it.
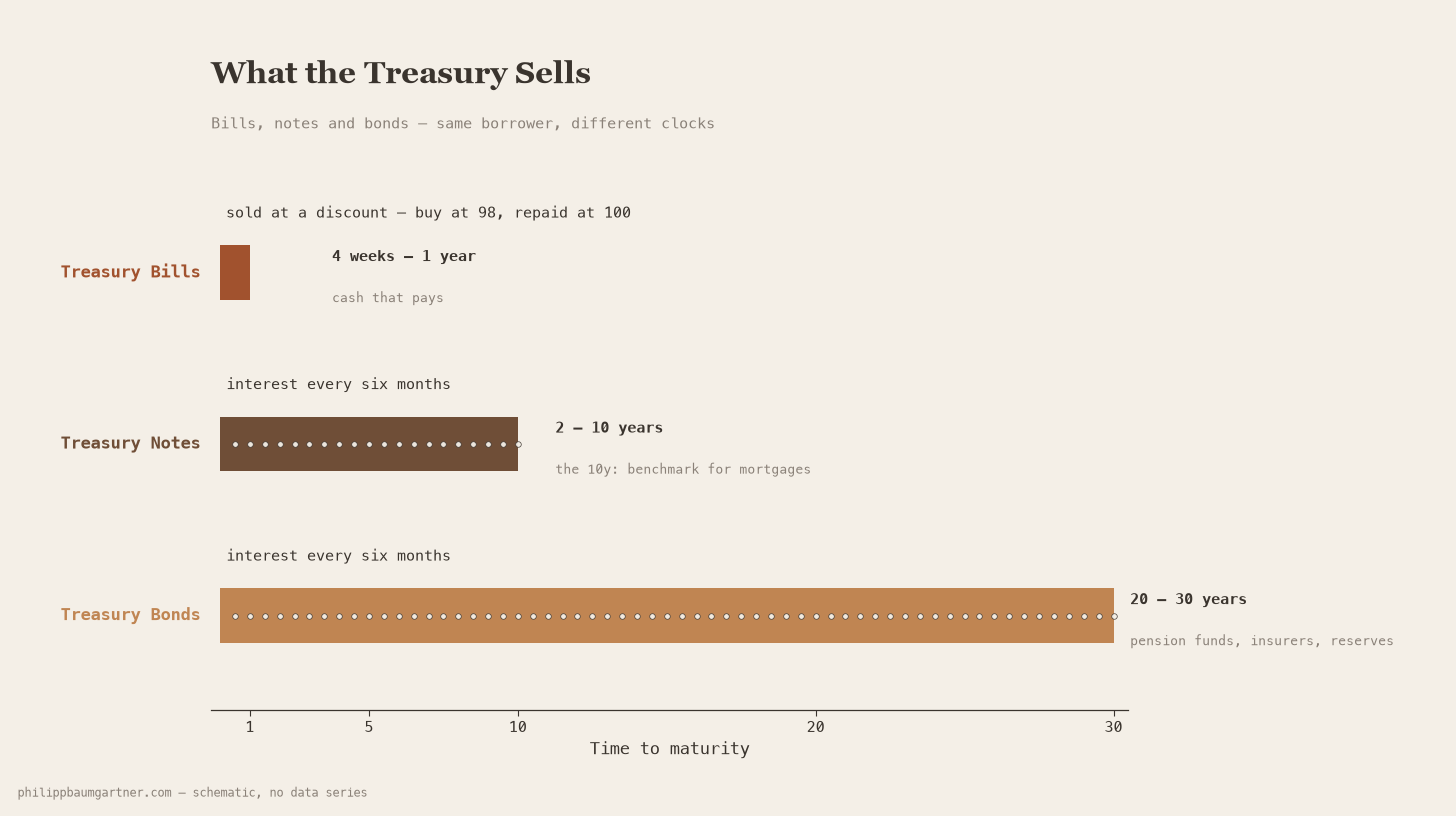
The three instruments, schematic
Chapter 3: The rollover: how the machine works
Let’s get to the part that surprises most people. When a Treasury bill comes due, so essentially everything up to one year from issue date, the government does not pay it down out of tax revenue. It sells a new bill and uses the proceeds to redeem the old one. This creates a cycle where the debt does not shrink at any time but rotates. Old paper out, new paper in, week after week, at whatever rate the auction produces that day.
There is nothing scandalous about this. Every government with its own currency operates exactly this same protocol, and large corporations roll their short-term funding on the same principle. The point is not that rolling debt is illegitimate. The point is what happens to a borrower when a very large share of the balance sheet rolls very often? Quite simply put, the borrower’s costs start tracking current interest rates almost in real time.
The scale is easy to underestimate, so here it is in the auditors’ numbers. In fiscal 2025 the Treasury refinanced 9.1 trillion dollars of maturing securities and borrowed 1.9 trillion on top to cover the deficit, a combined 11 trillion dollars of issuance in a single year, equal to about 36 percent of US economic output. A decade of normal operations used to require issuance around 21 percent of output. The machine has not just gotten bigger with the economy. It has also gotten bigger relative to it.
And it has gotten shorter. The four-week bill, the shortest standard instrument the Treasury sells, averaged 47 billion dollars per auction in 2016. Fast forward ten years, in 2026 it averages 101 billion dollars, which makes it the single largest offering in the entire Treasury lineup. Larger than the famous ten-year note. Larger than the thirty-year bond. The most important funding operation of the United States government is one that has to be repeated every seven days.
But what does this all mean you might ask? In plain terms, the state pays old debts with new debts, and the price of doing so gets reset every week.
Chapter 4: The choice: financing short is a position
Now let’s get to the interesting question. How much of its debt should a government keep in short paper? The Treasury has an advisory committee for exactly this, the TBAC, staffed by the banks and funds that actually buy the paper. Their long-standing guidance is quite straightforward. A sovereign should keep bills at roughly 15 to 20 percent of the total. Below that, you give up the cheapest and most liquid funding there is. Above that, your budget starts swinging with every rate move.
Where does the US stand? Bills currently make up 21.5 percent of marketable debt, which is above the recommended band. The share peaked near 35 percent in the panic of 2008, when the government funded emergency programs with whatever sold fastest. It then fell for years as the Treasury deliberately termed out its debt, reaching 10 percent by 2015. In September 2023 it crossed back above the 20 percent line, and it has stayed above ever since.
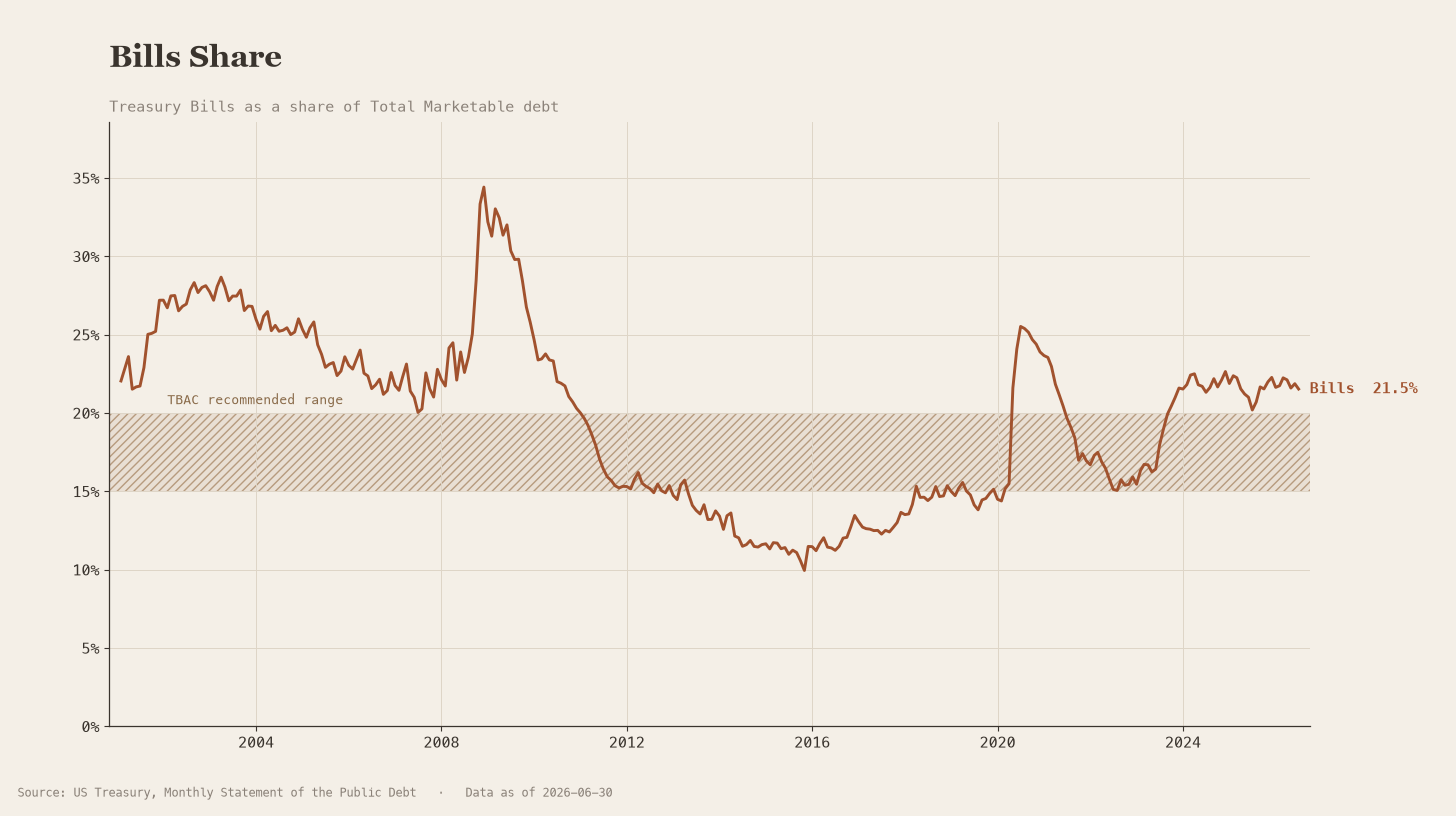
Bills as a share of marketable debt vs. TBAC band, 2001–2026 · Source: US Treasury MSPD
The timing of that crossing is worth understanding, because it reveals the logic.
By 2023, the Fed had raised rates at the fastest pace in four decades, and something unusual had happened along the way: The yield curve inverted. That means that short-term borrowing had become more expensive than long-term borrowing.
Normally lenders charge more for longer waits, and the reason is intuition you already have. Nobody would accept the same rate for lending a friend money until next month and until 2056. The longer the money is out of reach, the more can happen to it. Let it be inflation that can slowly but gradually eat the repayment, rates can rise and leave the old loan looking foolish, and life does not pause while you wait.
Time is risk, and risk has a price, which is why the interest curve normally slopes upward from short to long. In 2023 that slope had flipped. For the Treasury that created a strange menu. The cheapest funding on offer was also the longest, but taking it meant signing up for a generation of elevated rates, with no way back once the ink dried.
Issuing bills instead meant paying today’s high short rates only for as long as they lasted, with a free option to refinance cheaper once the Fed cut. Reasonable people can call that prudent flexibility or a rate bet with public money, and in Washington they did argue about exactly that, loudly.
What nobody disputes is that the shift happened, that it has persisted across two administrations and two Treasury secretaries, and that it shows no sign of reversing. The bill share sits near its post-crisis high today. Do you notice something about the two numbers in this paper so far?
Bills are 21.5 percent of the stock, yet 32.6 percent of the debt matures within a year. The gap consists of notes and bonds sold years ago that happen to come due now. One number is a policy choice being made today. The other is the accumulated consequence of decades of choices. Most coverage blurs them into one scary statistic. They are two different things, and this paper needs both. The stock figure actually understates what is happening, because the flow points harder in the same direction: roughly 85 percent of everything the Treasury currently issues is bills. The outstanding share moves slowly because the stock is enormous, but nearly every new financing decision is a short one.
I do not think this is an accident or an oversight. Financing short is a position. A borrower who locks in thirty-year money is indifferent to the next rate decision. A borrower who rolls a third of the balance sheet every year benefits from every rate cut within weeks and pays for every hike just as fast.
The United States has effectively put itself in a floating-rate mortgage. Officials call it neutral debt management. The balance sheet calls it a position: the government is long Fed cuts. It profits when rates fall, and it is exposed when they rise.
Once you see this, previously confusing things start making sense. It explains why fiscal officials have become loudly opinionated about monetary policy, which used to be taboo. It explains why every move at the short end of the curve is now a budget event. And it also explains why the Treasury and the Fed can no longer be analyzed as independent actors because one of them sets the price of the other’s refinancing, every single week.
Chapter 5: What the machine costs
The bill arrives daily. Net interest on the federal debt runs about 3.5 billion dollars per day, roughly one trillion per year. That makes interest the third largest item in the federal budget, behind Social Security and Medicare and ahead of National Defense. About 22 cents of every tax dollar so essentially a quarter of every penny collected goes to servicing the sovereign debt engine.
But to be honest with you, the speed of change is the real lesson here. Five years ago the average interest rate across all marketable Treasury debt was 1.54 percent. Today it is 3.35 percent. It more than doubled in five years, and the reason is the rollover machine itself. Trillions of dollars borrowed in 2020 and 2021 at rates near zero have already come due and been replaced with paper costing 4 percent and more. A mortgage fixed for thirty years would not care what the Fed did last year. Debt that rotates by a third annually absorbs every rate change within months. Each percentage point of policy rate, applied to 10 trillion of annually maturing debt, is on the order of 100 billion dollars of yearly interest cost arriving within the first refinancing cycle. That is roughly a NASA budget every few months, decided by the auction tape.
The same door swings both ways: each future cut would flow back into the budget just as quickly. Right now, the market is not offering one. Futures currently price the Fed’s next move as more likely a hike than a cut, and the new Fed leadership is signaling it would rather be dragged into easing than rush there voluntarily.
That means the sensitivity runs the painful way first. A government financed short does not get to wait out a hiking phase the way a thirty-year borrower would.
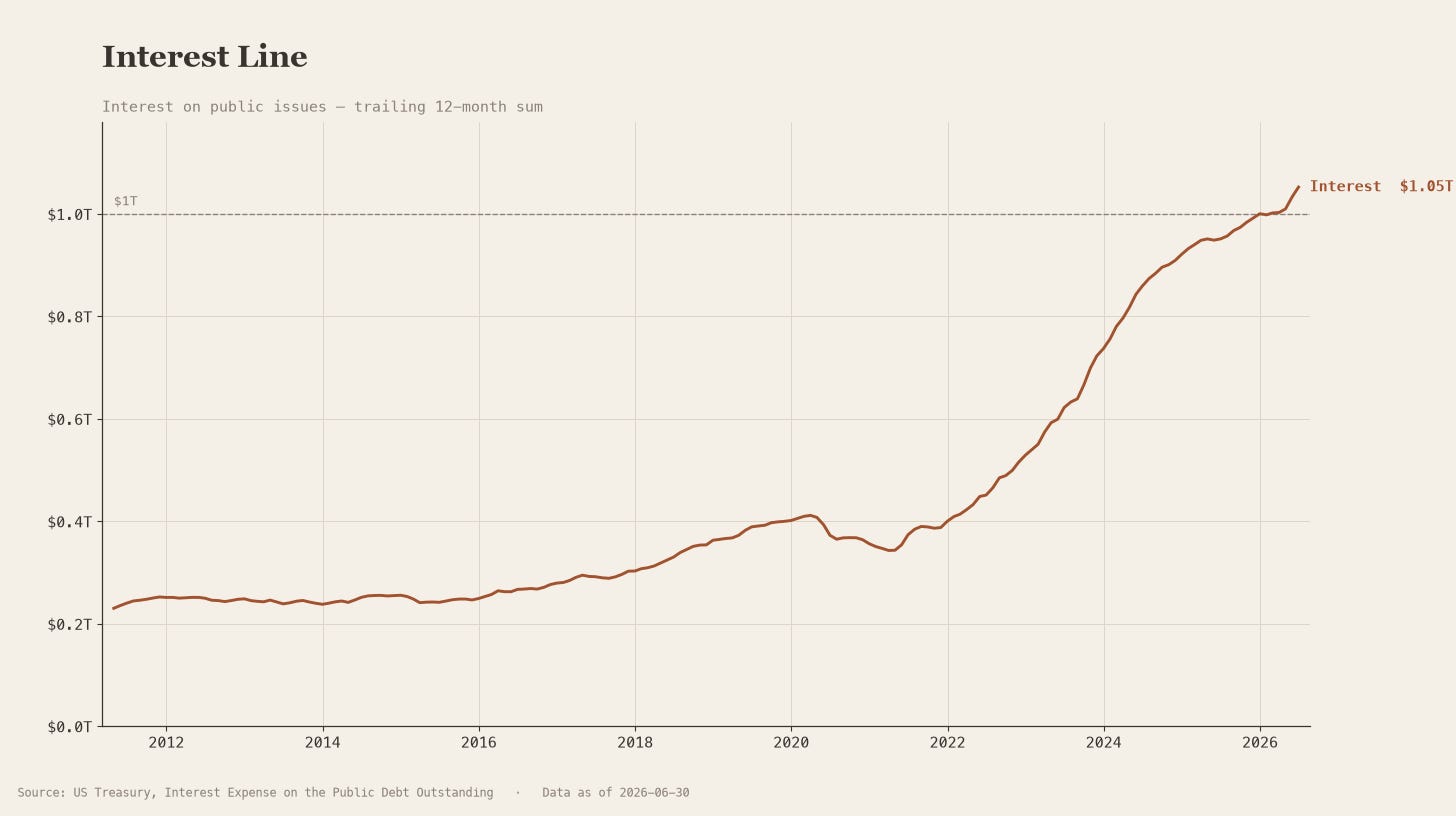
Interest on public issues, trailing 12-month sum · Source: US Treasury, Interest Expense
The line crossed one trillion dollars in late 2025 and sits at 1.05 trillion today. Ten years ago it ran a quarter of that.
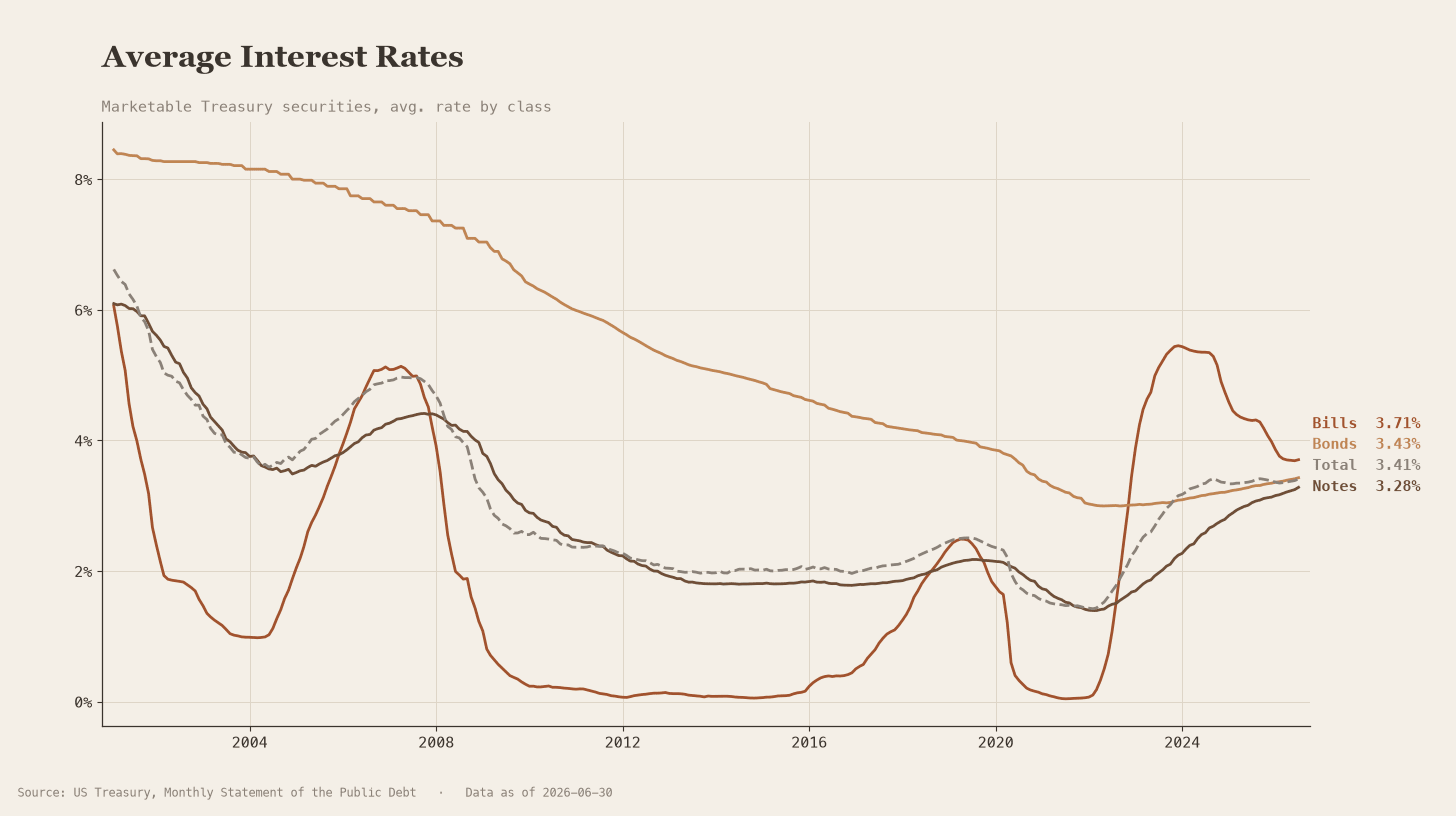
Average interest rate by security class, 2001–2026 · Source: US Treasury MSPD
This chart makes the mechanics visible. The bills line (short term treasuries) is the volatile one, collapsing toward zero in the easy years and snapping to 4 percent within months of the hiking cycle. The bonds line barely moves, still digesting decisions from decades ago. The total line, the one the budget feels, tracks closer and closer to the volatile one as the overall general debt changes to shorter maturity. That convergence is the whole paper in a single picture.
Chapter 6: Who is on the other side?
A machine that sells 100 billion dollars of paper per auction only works when somebody reliably buys. So who does take the opposite trade on this?
A decade ago, foreign holders, including central banks like China’s and Japan’s, owned about a third of the US Treasury debt. Today they hold about a quarter. Just by looking at the numbers one might think that this is not even that bad and that this is a slow rebalancing. But this is only partly correct. What this means is that the marginal buyer has become domestic. At the short end the dominant buyer is a money market fund. This is a fund that holds only very short, very safe paper and passes the interest to its investors.
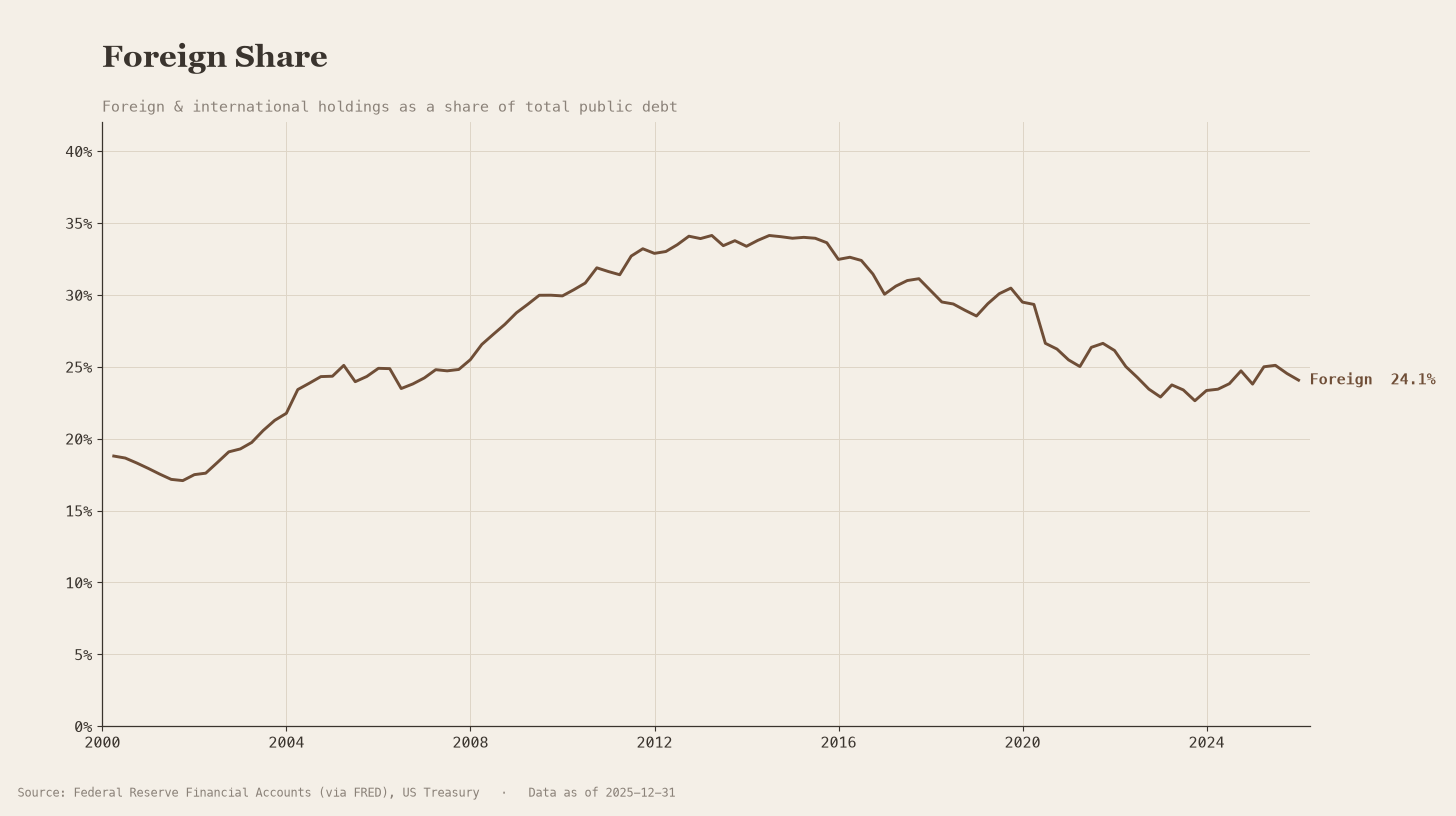
Foreign & international holdings as a share of total public debt · Source: Fed Financial Accounts (via FRED), US Treasury
When a broker pays 4 percent on uninvested cash, a money market fund holding Treasury bills is usually the reason. The industry has swollen to 7.9 trillion dollars, because savers finally got paid for cash again, and it holds 3.4 trillion dollars of Treasury securities on the Fed’s own accounting. The rollover machine found its counterparty in the ordinary saver’s brokerage account.
It also further found a newer counterparty in a place traditional finance rarely looks at.
Stablecoins are digital tokens on public blockchains designed to always be worth exactly one dollar, and the companies that issue them hold real reserves so every token is backed. Those reserves sit overwhelmingly in Treasury bills. Tether, the largest issuer, reports 141 billion dollars of bill exposure, which would rank it as the seventeenth largest holder of US government debt in the world, ahead of Germany.
Circle, the second largest, parks roughly 80 percent of its reserves in a fund that buys nothing but bills and overnight loans. Since last year this is not even a preference anymore but law. US stablecoin legislation requires issuers to hold reserves in cash or bills maturing within 93 days. Every new tokenized dollar is, by statute, demand for exactly the paper the rollover machine needs to sell most. A technology built to route around the banking system ended up financing the government at its most rate-sensitive point, and Washington wrote the arrangement into law.
I find this the single most underappreciated link between the two worlds of finance.
And quietly, a third buyer has re-entered the room: the Federal Reserve itself. The Fed holds a large portfolio of Treasuries as a byproduct of past crisis programs, and as that portfolio is maintained and reinvested, its purchases have shifted toward bills.
The Treasury’s own advisory materials now model Fed bill buying as a structural source of demand at the front end. Let’s read that back slowly: the institution that sets the price of short money is also becoming a steady buyer of the short paper whose price it sets.
Nothing about that is hidden or improper, but it tightens the loop one more turn. Is this kind of demand healthy? One useful tool is the bid-to-cover ratio, which measures how many dollars of bids arrive per dollar of paper sold.
On four-week bills it sits near 2.7, meaning nearly three dollars chase every dollar available. The machine is not straining. What has changed is who keeps it running, from foreign governments toward domestic funds, crypto reserves, and the central bank itself. Composition like that moves slowly, until it does not, which is exactly why it belongs on a monthly watchlist rather than in a one-time headline.
Chapter 7: The honest counterargument
Never trust a story that hides its strongest objection. So here it is, in its best form.
Measured differently, US debt has rarely looked so patient. The measure in question is the weighted average maturity, and it is less technical than it sounds: take every outstanding security, ask how many years it has left, and average those lifetimes, giving big securities more weight than small ones. The answer today is about 71 months, almost six years, and close to the highest level in 26 years. On top of that, roughly a third of the debt needs no refinancing for at least five years. None of this is an accident either. The Treasury of the 2010s deliberately used the era of near-zero rates to lock in long, cheap money, and that cushion is real. Anyone pointing at it is pointing at a true thing.
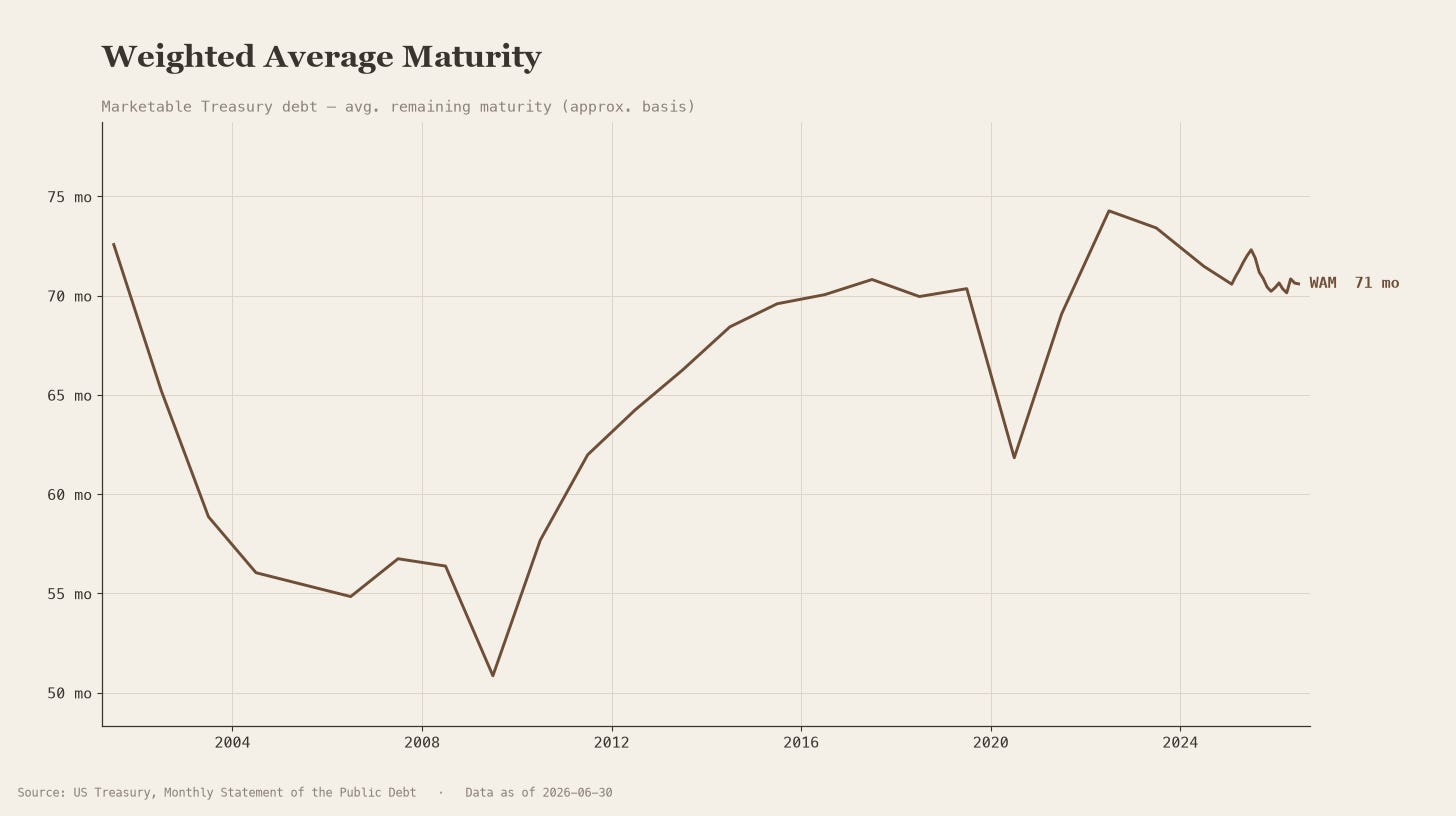
Weighted average maturity of marketable debt · Source: US Treasury MSPD, own calculation
The second objection is just as fair. Ten trillion dollars of maturing debt sounds like ten trillion dollars that has to be found somewhere, and it is not. The investors holding that paper already own it, and when it matures, most of them put the money straight back into the next auction, almost automatically. Think of the money market fund whose bill matures on Tuesday: it does not take the cash and leave, because holding safe short paper is its entire job. It buys another bill on Tuesday. Refinancing is mostly this, the same money rotating from old paper into new. The true nightmare scenario, an auction where nobody shows up, is remote for the country that issues the asset the whole financial world treats as its safest parking spot.
So which is it? Is the debt patient or is it urgent? The honest answer is both, because the two claims measure different things, and seeing why is the most useful thing this paper can teach.
The average is long. The front is heavy. Both at once. Here is how: the average gets pulled up by a relatively small amount of very old, very long paper, thirty-year bonds sold decades ago that still have decades to run. A few far-away dates can stretch an average a long way. Meanwhile the bulk of the money sits at short maturities. My own calculation from the Treasury’s records puts 67.7 percent of all marketable debt inside five years. So when someone quotes the near-record average maturity, they are describing the tail. When this paper describes a third rolling over every year, it is describing the front. Both use real numbers. They just answer different questions. The question that matters for the budget is the second one, because the front is where debt gets repriced, and repricing is what moves the interest bill.
That is why my conclusion is deliberately not a crisis call. I do not think the United States faces a funding crisis. What I think is this: the country has wired its budget directly to the Fed’s decisions, so that every rate move flows into government interest costs within months. A wire is not a crisis. A wire is a connection, a transmission channel, and knowing where the transmission channels run is most of what reading markets actually means.
One more thing, because pretending not to have a view would be its own kind of dishonesty. I will tell you where I personally lean. I think the political pressure to solve this tension with easier money, lower rates sooner than inflation alone would justify, will grow with every refinancing cycle. Understand that this is a conviction statement. The data in this paper shows the pressure exists. It cannot show how the fight ends.
And a conviction that cannot be wrong is worthless, so here is what would weaken mine. The bill share drifting back inside the advisory band would weaken it, because it would mean the Treasury is unwinding the short position rather than deepening it. The interest line flattening while rates stay firm would weaken it, because it would mean the budget is absorbing the pain without political rescue. Auction demand holding through a full hiking phase without official support would weaken it too, because it would mean the machine does not need easier money to keep running. The monitor below tracks exactly these things, which means it exists partly to keep me honest. Month by month, the same five numbers will show whether that pressure is turning into policy, or whether the credibility camp holds the line.
Chapter 8: What you can do with this
This is not investment advice, and it deliberately contains no forecast. What it gives you is a lens, and a lens is only worth something when you know where to point it. Four uses.
Read the Fed differently. At the next rate decision, ask the question this paper forces: who is being financed at this rate, and at what horizon? A central bank whose sovereign rolls a third of its debt annually is not setting rates in a vacuum. It is setting its own government’s refinancing cost. Every debate about central bank independence has this concrete, dollars-per-week mechanism underneath it, and every press conference reads differently once you hold that in mind.
Understand your own cash. The yield on a money market fund, a broker’s cash sweep, even a decent savings account, all of it sits downstream of the bill auctions described here. Anyone earning 4 percent on parked cash is, through one or two intermediaries, one of the buyers keeping the rollover machine running. That is the actual plumbing, and it also means the income on your cash and the interest bill of your government are the same number seen from two sides.
Place the crypto story correctly. The next time someone calls stablecoins a sideshow, you have the number: the largest issuer alone holds more US government debt than Germany. The next time someone calls crypto disconnected from the real economy, you know the connection is written into federal law. Both maximalist stories, crypto as pure escape and crypto as pure casino, break on this fact.
Filter the noise. You will keep encountering two kinds of coverage. Panic pieces shouting that a third of the debt is about to hit a wall, and reassurance pieces pointing at record-long average maturities. Both quote real numbers, both are incomplete, and you now know which number answers which question. That filter alone puts you ahead of most of the commentary.
Chapter 9: The monitor
A frame is only useful when you can hold events against it, so this paper comes with a fixed monthly check. The Treasury publishes its debt statement on the fourth business day of each month. On that day, Rollover Watch updates five numbers. Always the same five, always in the same order.
The bill’s share of marketable debt, currently 21.5 percent, read against the advisors’ 15 to 20 percent band. The share of debt maturing within one year, currently 32.6 percent. The average interest rate on the debt, currently 3.35 percent. The interest bill itself, which just crossed one trillion dollars over the past twelve months and sits at 1.05 trillion today. And the bid-to-cover on four-week bills as the pulse of demand, currently near 2.7. Every figure is computed from the Treasury’s published security-level data with the same pipeline behind every chart in this paper, and a sixth element each month is one sentence pulling the month’s main event through this lens.
These five are not a dashboard for its own sake. They are chosen so that the argument of this paper, including my own stated lean, can be checked against them and fail. The bills share tests whether the short position deepens or unwinds. The interest line tests whether the pressure is real. The bid-to-cover tests whether the machine needs help. Charts that move slower, like the average maturity of the whole stock, will reappear here whenever they have something new to say, but the monthly core stays fixed.
A government that rolls a third of its debt every year answers the question of every Fed meeting before it is asked. From next month on, we will watch it precisely and update on a recurring basis. Stay tuned.
Data: US Treasury, Monthly Statement of the Public Debt and auction records, as of June 30, 2026. Money market figures from the Federal Reserve’s financial accounts and ICI. Foreign holdings from the Federal Reserve Financial Accounts via FRED, as of Q4 2025. Stablecoin reserve figures from issuer attestations, which are point-in-time statements rather than full audits. Corroborating estimates from Apollo Global Management, the GAO and the Treasury Borrowing Advisory Committee. All calculations reproducible from published security-level data. Nothing here is investment advice. It is a lens.